The U.S. Congress continues to debate a second COVID-19 economic relief package, even as many states send letters to Americans who may have received an overpayment during the first round of federal unemployment insurance payments. Unless Congress acts soon, the last of the direct federal payments to 3.3 unemployed workers will end on December 31.
Under the CARES Act passed in March, the federal government provided an additional 13 weeks of unemployment payments, in addition to a $600 weekly payment over and above the basic payments. The expanded $600 payments expired in late July. The extended benefits program, along with a program to provide payments to gig workers, is set to end this month.
The speed with which the act was passed and funds distributed to people who lost their jobs due to the COVID-19 pandemic naturally led to some administrative issues. In Texas, for example, state officials estimate that 231,000 people have been overpaid some $261 million this year. That’s an average overpayment of around $1,130 per person.
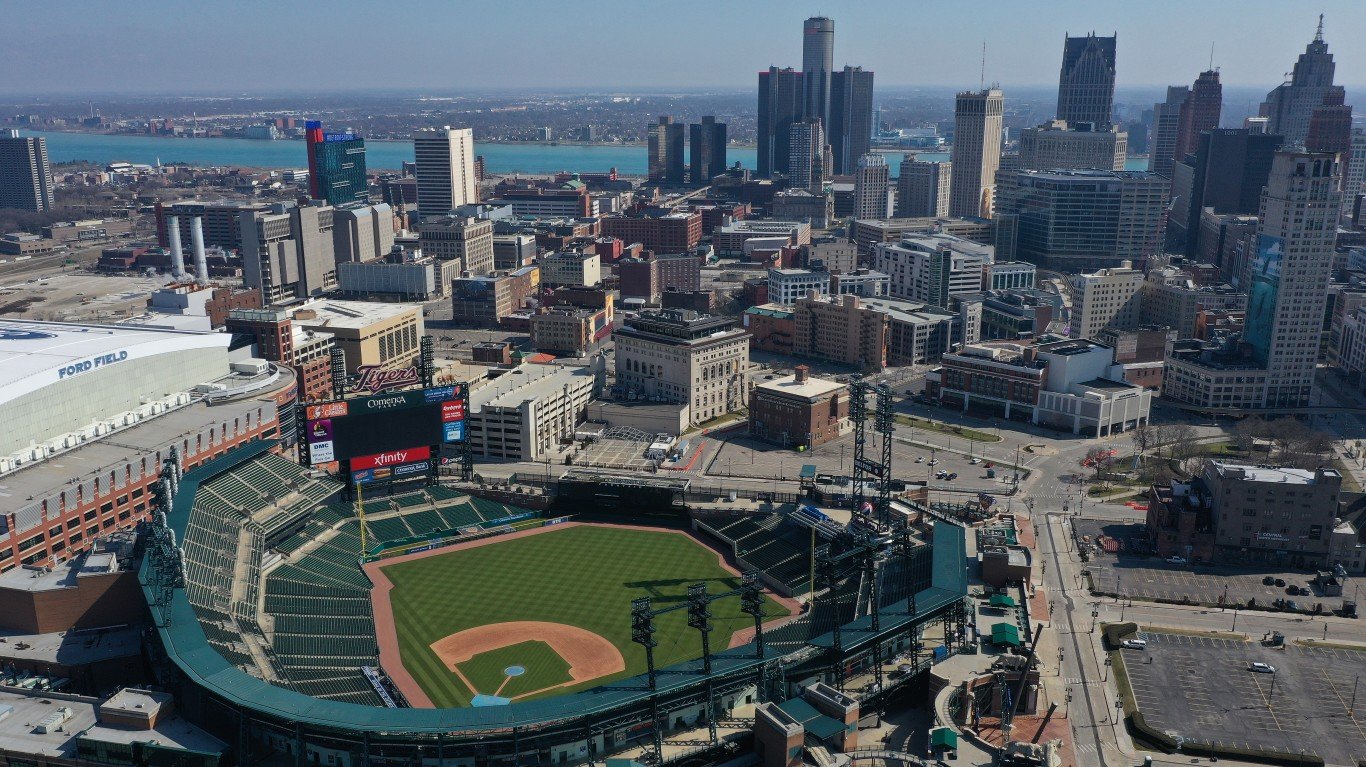
Extrapolating from state-level data from the U.S. Department of Labor for the three-year period from July 2016 to June 2019, the state most likely to have overpaid unemployment benefits is Michigan. During that period, Michigan overpaid benefits by a total of just less than $78 million. That’s out of a total of about $190 million in total improper (either too little or too much) payments. When Michigan’s Unemployment Insurance Agency (UIA) makes a mistake, the odds favor an overpayment.
[nativounit]
As of early November, 2.3 million Michigan residents had applied for jobless benefits and collected some $25 billion. The number of recipients represents nearly half of Michigan’s total workforce of 4.9 million people.
The state’s UIA estimated that 185,000 people with active claims were not currently receiving payments, and the agency has seen about 111,000 fraud attempts. The agency sought identity verification from more than 500,000 claims and had so far found that 128,000 were legitimate claims and those were paid.
Fraud is suspected in most of the remaining identity verification cases, and while the state has not revealed how much money has been fraudulently received, the UIA did say that the state has recovered $30 million from imposters and has taken action to recover $45 million more. The state also has recovered about $1.3 million of $8.2 million in duplicate payments. Overpayments total $6.6 million.
The following table shows how much each state (plus the District of Columbia and Puerto Rico) have improperly paid out in unemployment benefits for the period between 2016 and 2019. The table includes Labor Department data for the percentage of improper payments based on a state’s three-year total, the percentage of overpayments based on the three-year total and the dollar amount of overpayments by state.
| State | Improper Payment Estimate | Improper Payment Rate | Overpayment Percentage | Overpayment Amount |
|---|---|---|---|---|
| Michigan | $189,940,328 | 41.27% | 99.37% | $77,894,529 |
| Massachusetts | $249,271,989 | 21.44% | 96.92% | $51,798,719 |
| New York | $270,438,298 | 13.80% | 96.23% | $35,914,206 |
| California | $434,992,802 | 8.02% | 97.13% | $33,885,939 |
| New Jersey | $203,406,561 | 13.06% | 88.97% | $23,635,842 |
| Maryland | $96,526,778 | 20.34% | 99.51% | $19,537,020 |
| Illinois | $165,276,511 | 11.27% | 93.35% | $17,387,089 |
| Washington | $115,071,325 | 13.78% | 98.33% | $15,592,165 |
| Pennsylvania | $142,397,709 | 9.10% | 98.02% | $12,701,876 |
| Connecticut | $71,509,152 | 16.63% | 98.56% | $11,720,350 |
| Ohio | $80,858,629 | 13.11% | 97.64% | $10,349,905 |
| Wisconsin | $55,372,907 | 15.01% | 97.14% | $8,073,370 |
| Texas | $79,718,089 | 7.96% | 97.99% | $6,218,011 |
| Oregon | $50,482,713 | 12.61% | 96.03% | $6,113,457 |
| Colorado | $39,163,931 | 12.41% | 95.00% | $4,617,427 |
| Tennessee | $27,168,938 | 17.05% | 98.42% | $4,558,948 |
| Kentucky | $25,936,535 | 17.43% | 98.85% | $4,468,865 |
| Minnesota | $55,086,536 | 7.55% | 97.22% | $4,043,352 |
| Kansas | $20,707,717 | 19.04% | 98.63% | $3,888,909 |
| Rhode Island | $21,104,519 | 18.13% | 98.29% | $3,760,825 |
| North Carolina | $17,050,493 | 22.23% | 98.25% | $3,723,828 |
| Nevada | $30,660,353 | 11.72% | 97.27% | $3,495,280 |
| Virginia | $27,885,336 | 12.01% | 97.67% | $3,270,950 |
| Florida | $29,962,886 | 10.84% | 98.89% | $3,212,021 |
| Arizona | $26,003,769 | 12.02% | 99.50% | $3,110,051 |
| Iowa | $33,919,345 | 9.52% | 95.38% | $3,079,877 |
| South Carolina | $16,184,246 | 11.01% | 98.82% | $1,760,846 |
| Idaho | $11,230,126 | 12.76% | 95.92% | $1,374,567 |
| Missouri | $17,308,202 | 7.32% | 98.09% | $1,242,729 |
| District of Columbia | $11,085,780 | 11.69% | 92.39% | $1,197,264 |
| Indiana | $13,150,194 | 8.88% | 97.64% | $1,140,122 |
| Nebraska | $8,074,446 | 13.10% | 98.55% | $1,042,411 |
| Louisiana | $9,789,818 | 10.70% | 97.85% | $1,024,994 |
| Montana | $11,357,136 | 8.86% | 96.39% | $969,899 |
| Alaska | $10,956,325 | 9.27% | 93.31% | $947,722 |
| Alabama | $10,331,587 | 8.96% | 99.22% | $918,478 |
| North Dakota | $7,456,901 | 11.20% | 98.75% | $824,733 |
| Arkansas | $9,131,706 | 9.16% | 94.87% | $793,545 |
| Oklahoma | $12,924,836 | 5.70% | 94.91% | $699,234 |
| Wyoming | $5,446,797 | 9.69% | 95.77% | $505,463 |
| Mississippi | $4,788,673 | 9.34% | 98.93% | $442,473 |
| West Virginia | $9,583,405 | 4.81% | 94.39% | $435,087 |
| New Mexico | $7,627,817 | 5.55% | 92.97% | $393,595 |
| Georgia | $9,683,205 | 3.92% | 99.49% | $377,645 |
| Maine | $4,055,199 | 8.27% | 96.74% | $324,416 |
| Delaware | $4,955,795 | 6.79% | 93.52% | $314,693 |
| New Hampshire | $3,151,543 | 10.31% | 95.73% | $311,057 |
| Puerto Rico | $4,912,325 | 7.05% | 89.79% | $310,950 |
| Utah | $5,858,665 | 5.23% | 98.28% | $301,135 |
| Hawaii | $7,586,641 | 3.61% | 87.53% | $239,738 |
| South Dakota | $2,030,182 | 7.85% | 97.58% | $155,512 |
| Vermont | $1,685,945 | 5.36% | 94.40% | $85,309 |
| TOTAL | $2,780,261,644 | 11.61% | 97.07% | $313,335,487 |
[recirclink id=824656][wallst_email_signup]
Contact [email protected] for any questions or corrections.