
In terms of health coverage, the number of uninsured Americans is dropping. That is the word from the Centers for Disease Control and Prevention (CDC), and it is close to real-time as it covers the first half of 2015. Its report was titled “Health Insurance Coverage: Early Release of Estimates From the National Health Interview Survey, January–June 2015.”
While this does not really focus on the costs of the insurance, the coverage numbers offer a lot of data. Health care under the Affordable Care Act, or Obamacare, is one of those political hot-button topics that draw fire, often from both sides of the political aisle.
Thursday’s CDC report showed that the number of uninsured persons has continued to fall since 2013. During the first six months of 2015, some 28.5 million people in America were uninsured at the time of their interview. That is represented as roughly 9% of the American population, and it was shown to be about 7.5 million less than in 2014 and about 16.3 million less than in 2013.
Below are some basic statistics, taken verbatim from the CDC report:
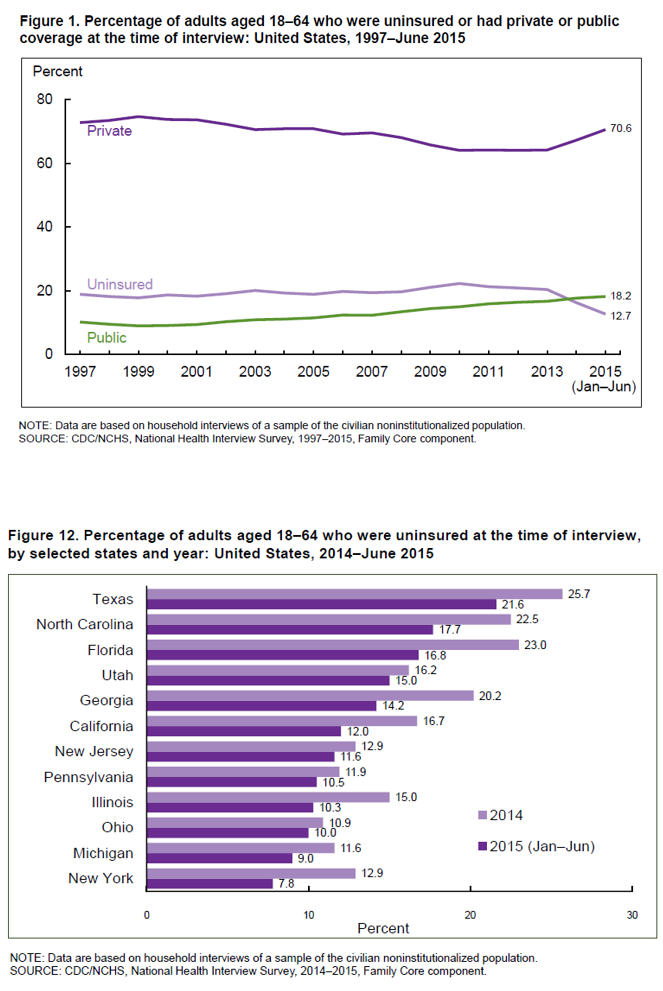
- Among adults aged 18–64, the percentage uninsured decreased from 16.3% in 2014 to 12.7% in the first 6 months of 2015. There was a corresponding increase in private coverage, from 67.3% to 70.6%. In 2013, among adults aged 18–64, 20.4% were uninsured and 64.2% had private coverage.
- Among children under age 18 years, the percentage with private coverage increased from 52.6% in 2013 to 56.0% in the first 6 months of 2015, reversing a 14-year trend of declining rates of private coverage.
- Among those under age 65, the percentage with private coverage through the Health Insurance Marketplace or state-based exchanges increased from 2.5% (6.7 million) in the fourth quarter of 2014 to 4.0% (10.7 million) in the second quarter of 2015 (April–June).
ALSO READ: 10 Cities Where You Don’t Want to Get Sick
Additional figures from the report were listed as follows:
- In the first 6 months of 2015 among adults aged 18–64, 26.6% of poor, 23.9% of near-poor, and 7.5% of those who were not-poor lacked health insurance coverage at the time of interview.
- In the first 6 months of 2015, 27.2% of Hispanic, 14.5% of non-Hispanic black, 8.8% of non-Hispanic white, and 7.3% of non-Hispanic Asian adults aged 18–64 lacked health insurance coverage at the time of interview.
- Among adults aged 18–64, the percentage who were uninsured at the time of interview decreased from 20.4% (39.6 million) in 2013 to 12.7% (24.9 million) in the first 6 months of 2015.
- Among persons under age 65, 66.6% (179.3 million) were covered by private health insurance plans at the time of interview from January through June 2015. This includes 3.8% (10.2 million) covered by private plans obtained through the Health Insurance Marketplace or state-based exchanges.
- Under provisions of the Affordable Care Act (ACA) of 2010, states have the option to expand Medicaid coverage to those with low income. In the first 6 months of 2015, adults aged 18–64 residing in Medicaid expansion states were less likely to be uninsured than those residing in nonexpansion states.
- Under provisions of the ACA, states have the option to set-up and operate their own Health Insurance Marketplace, rely on a Federally Facilitated Marketplace operated solely by the federal government, or have a hybrid partnership Marketplace that is operated by the federal government but within which the state runs certain functions and makes key decisions. In the first 6 months of 2015, adults aged 18–64 in states with a Federally Facilitated Marketplace were more likely to be uninsured than those in states with a state-based Marketplace or states with a partnership Marketplace.
- For the first 6 months of 2015, state-specific health insurance estimates are presented for 12 states for persons aged 18-64. Among the 12 states presented for the first 6 months of 2015, California, Florida, Georgia, Illinois, New York, and Texas, had a statistically significant lower percentage of uninsured than in 2014.
ALSO READ: America’s 50 Best Cities to Live In
This report was based on selected estimates of health insurance coverage for the civilian non-institutionalized U.S. population from January to June of 2015, with comparable estimates from the 2010 to 2014 period.
Before committing these figures to heart as absolute fact, keep in mind that the estimates for 2015 are based on data for only 54,097 persons. That is a far greater sample than is generally needed for statisticians, but it is a far cry short of being fully representative data for the group.
The combined infographic from the CDC below shows the number of uninsured, as well as in which states, through time.
ALSO READ: 4 Key FDA Decisions Expected in November and December
Contact [email protected] for any questions or corrections.