24/7 Wall St. Insights
- We used data from the Reason Foundation 27th Annual Highway Report to determine the states with the worst highways.
- Among the five highest-ranking states are southern locations.
- Also, 2 Dividend Legends to Hold Forever
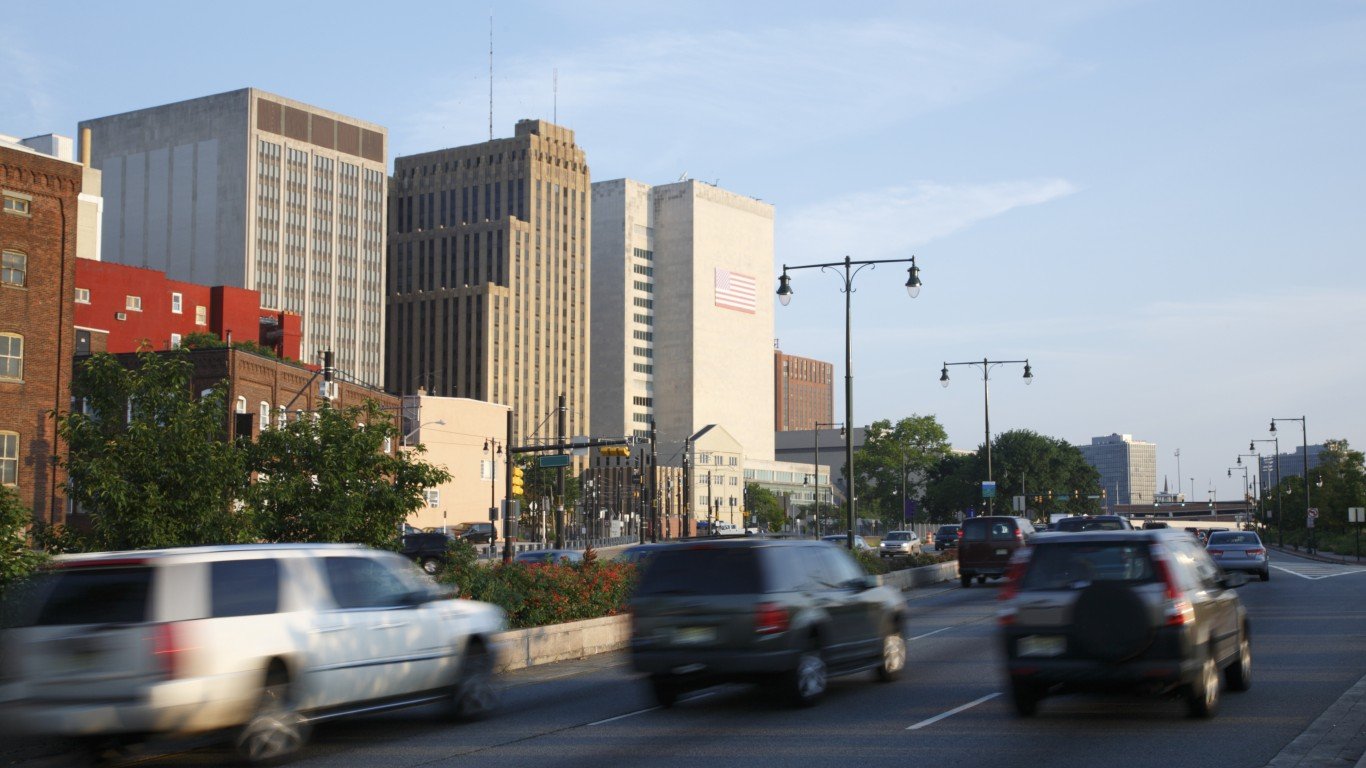
In 2021, the Biden administration was able to broker a bipartisan deal to pass into law the Bipartisan Infrastructure Law. This authorized $1.2 trillion to rebuild and reinvest in railways, public transit infrastructure, roads, bridges, ports, waterways, airports, and so much more.
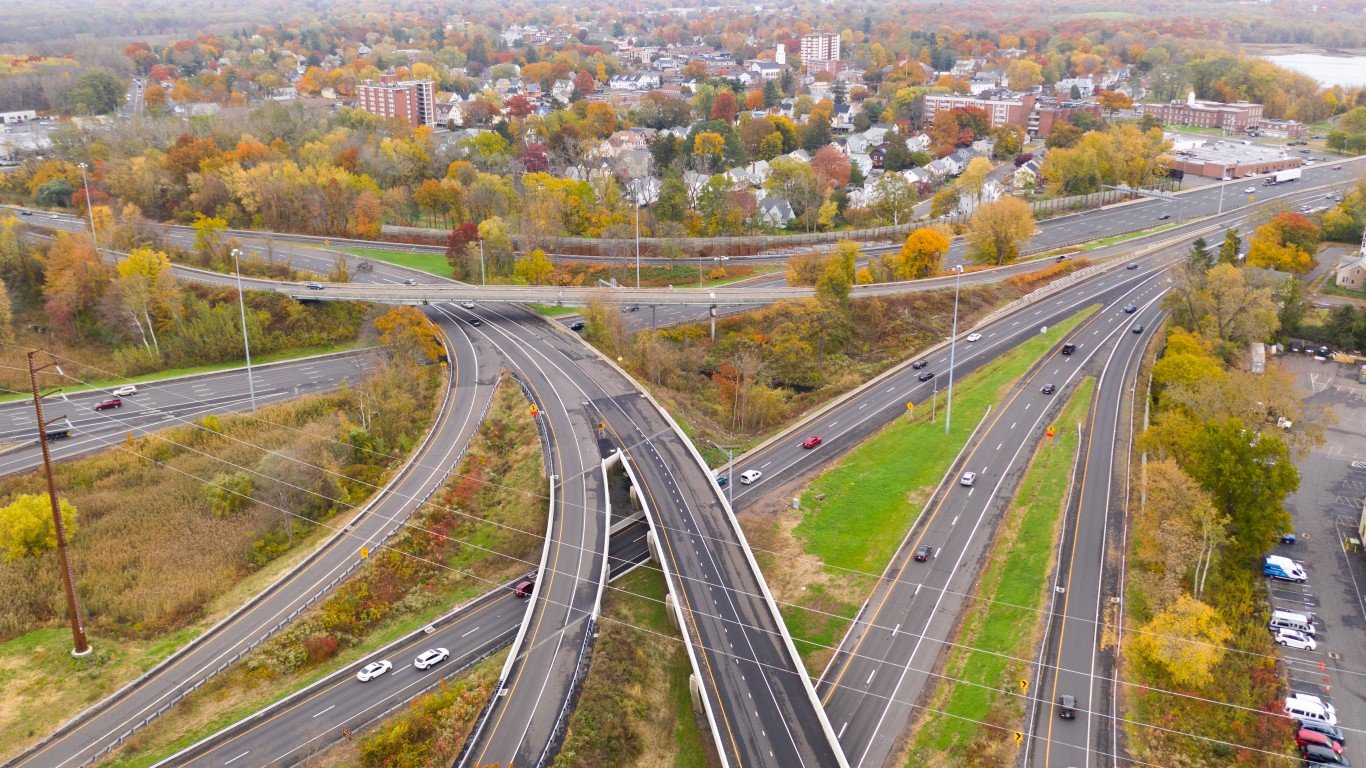
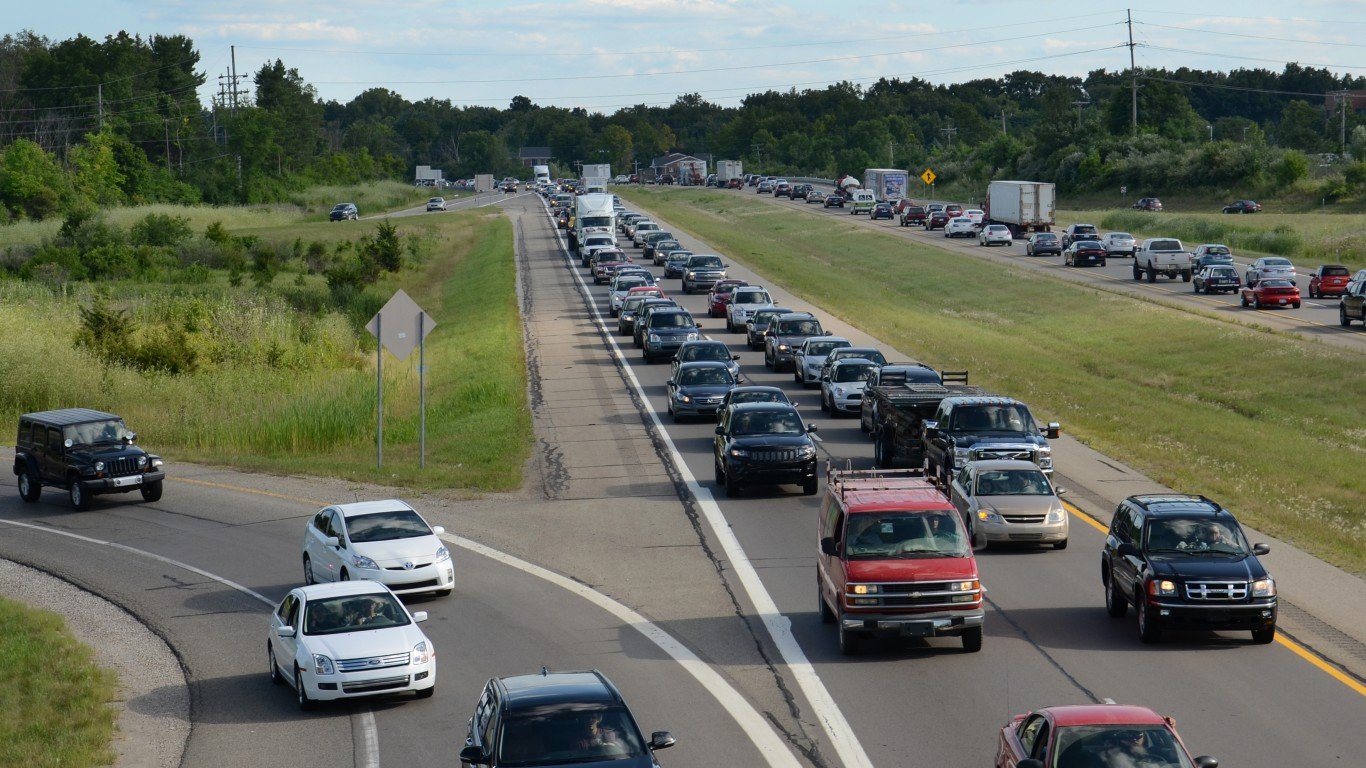
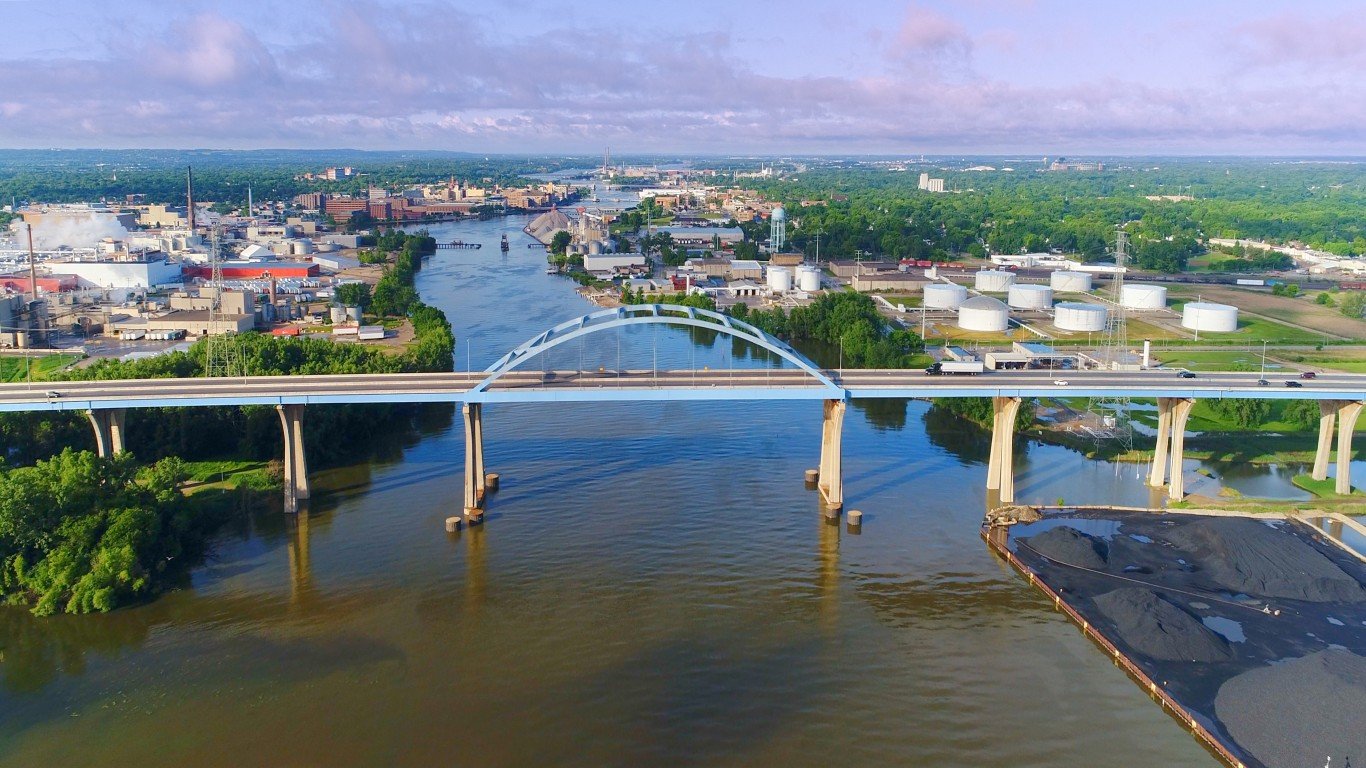
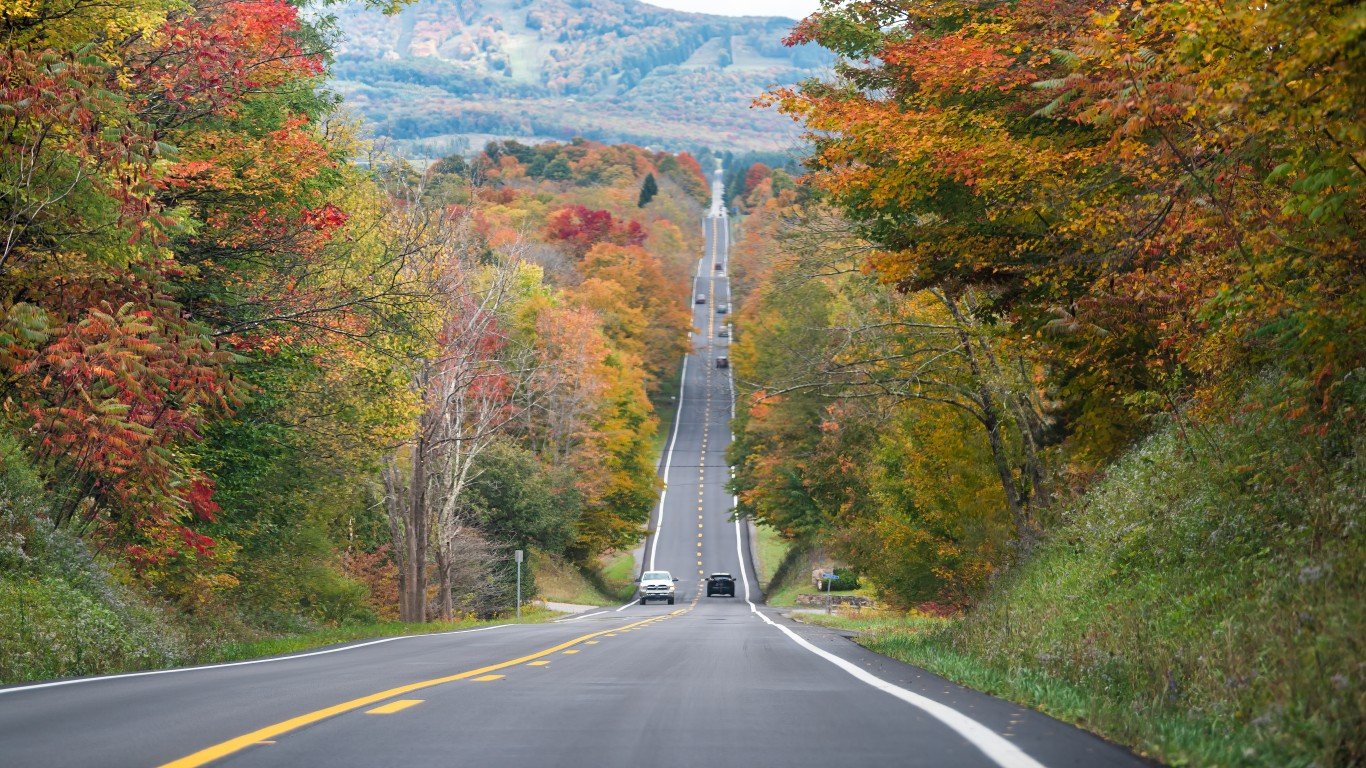
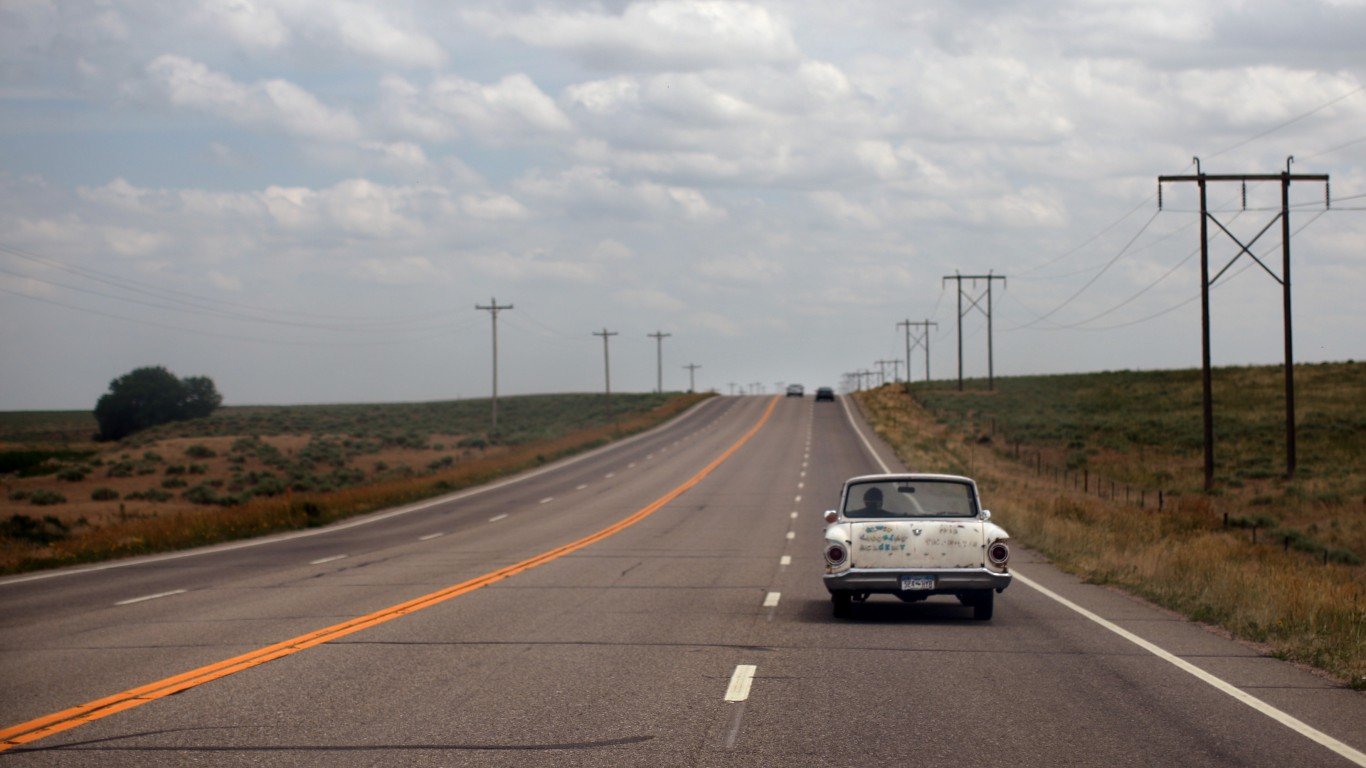
It is no secret that America’s infrastructure is in decline. Bridges and roadways across the nation are in dire need of repair. The 1950’s Federal-Aid Highway Act saw the building of multiple highways throughout the United States. However, seven decades later, these structures have not withstood the test of time. Many of these crumbling roadways, along with their reconstruction, have caused issues for travelers. A recent example of this is the rebuilding of Omaha’s North Freeway. With the 2024 Men’s College Baseball World Series in full swing, this much-needed highway project will likely result in heavy traffic.
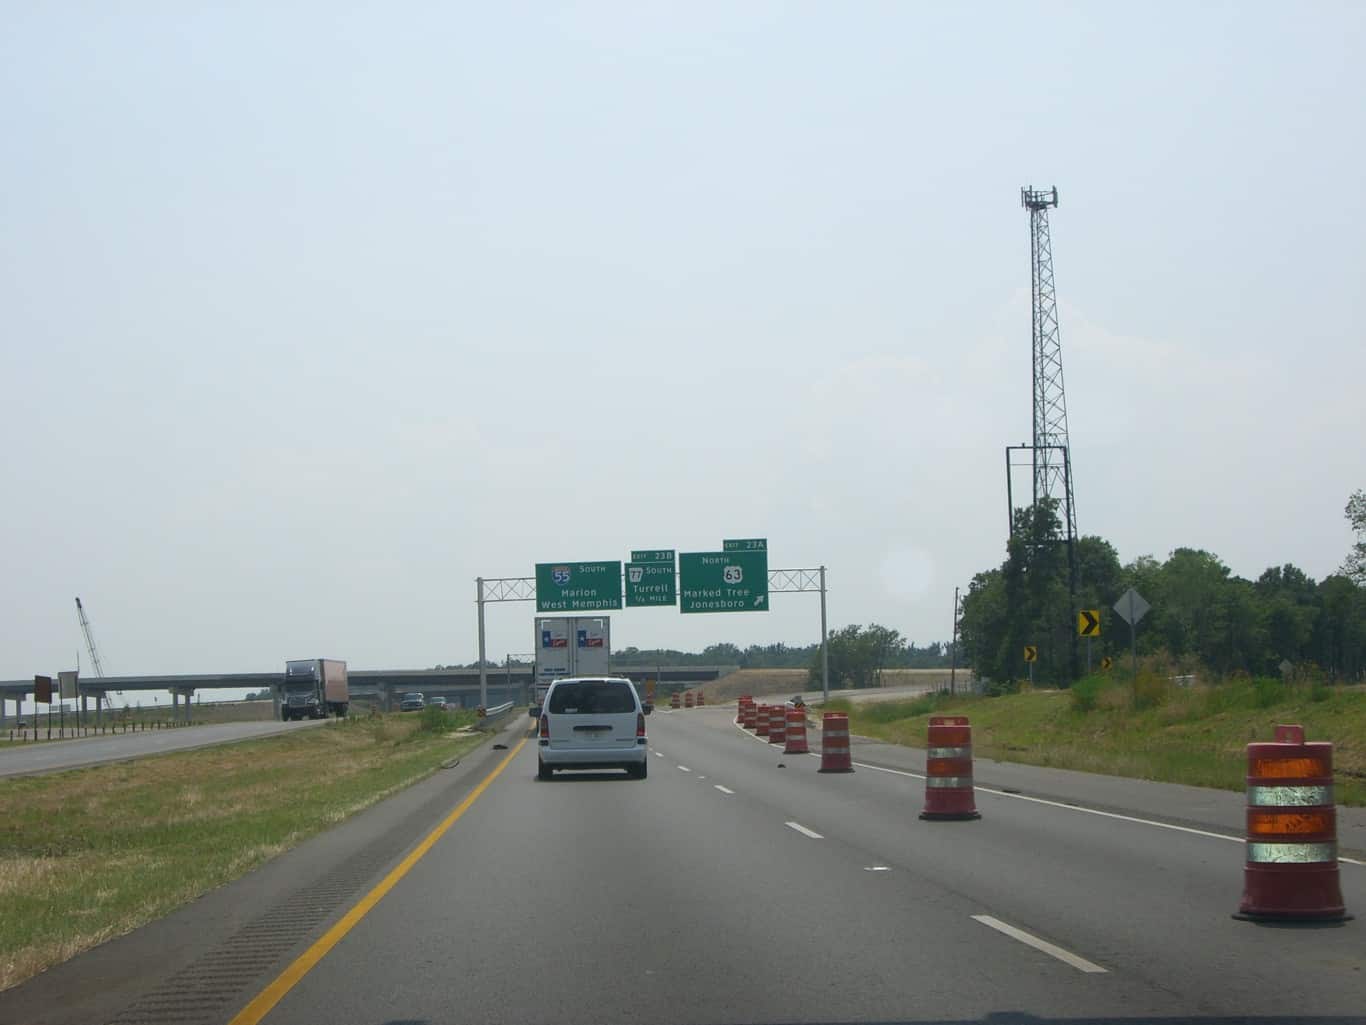
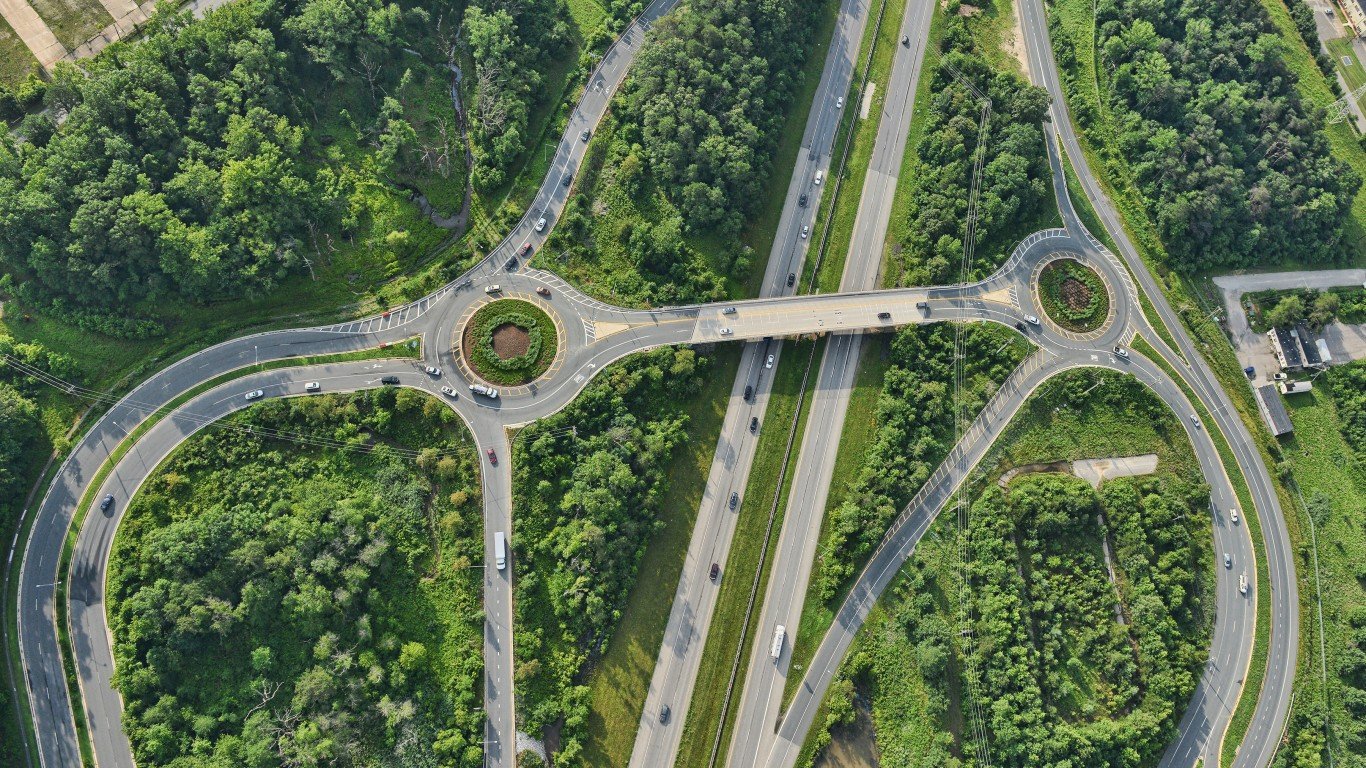
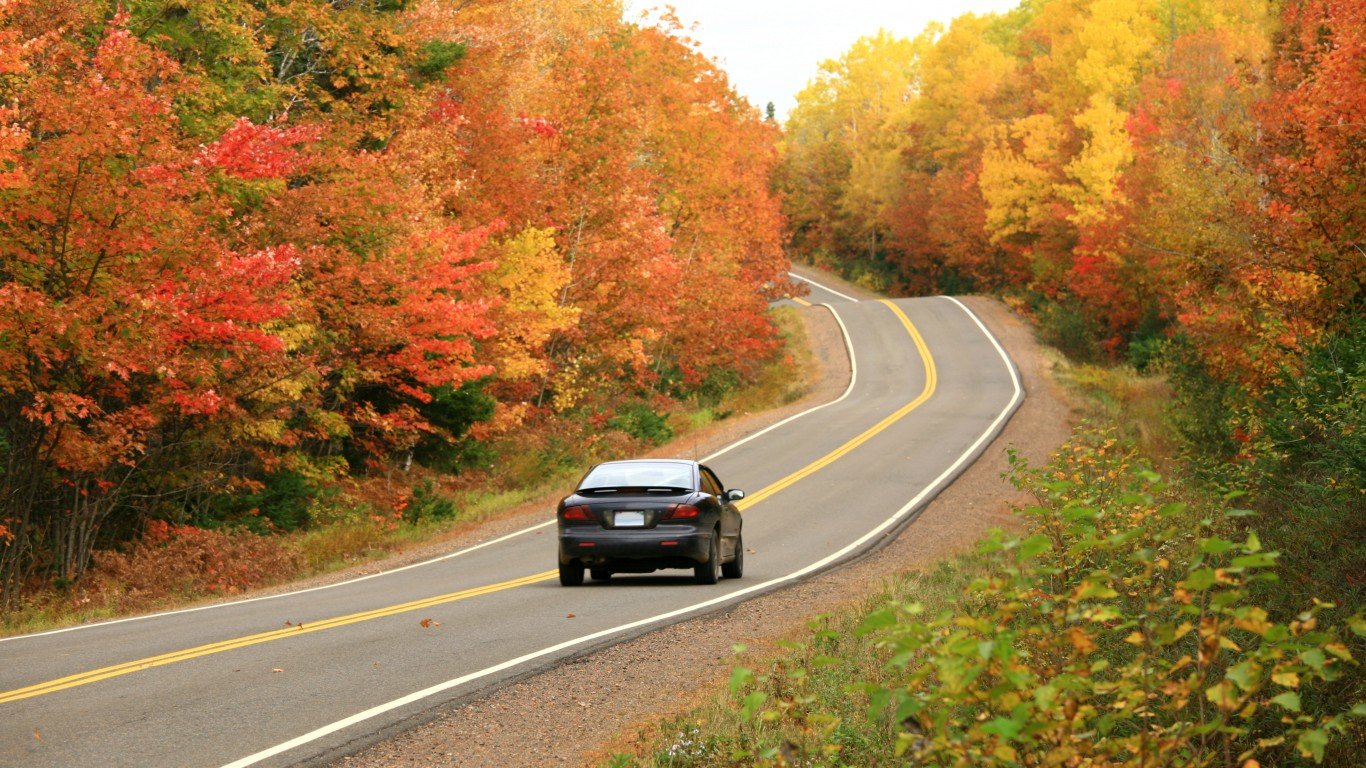
Each state faces its particular struggles with maintaining roadways. For example, in northern states where winters are freezing, potholes are much more common. To rank all 50 states, 24/7 Wall St. used data from the Libertarian Reason Foundation’s Annual Highway Report. This report accessed states based on highway system budgets and performance across 13 categories. These include deficient bridges, traffic fatalities, spending, administrative costs, and pavement conditions.
More specifically, 24/7 Wall St. utilized the Reason Foundation 27th Annual Highway Report to determine the states with the worst highways. This ranking covers all 50 states, including multiple measures. Additionally, we added disbursement categories. The multitude of categories considered include terrain, truck volumes, budgets, cost differences, climate, urbanization, maintenance policies, and age of the highway.
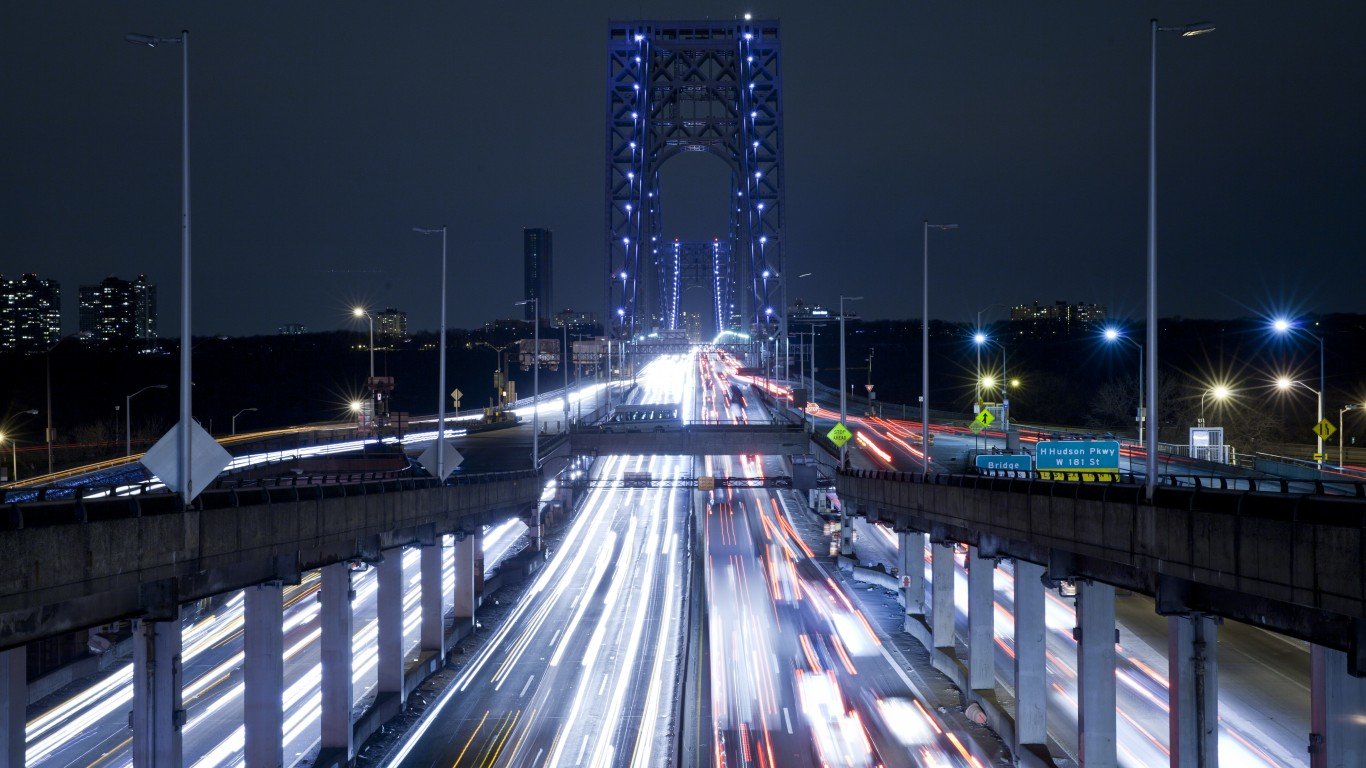
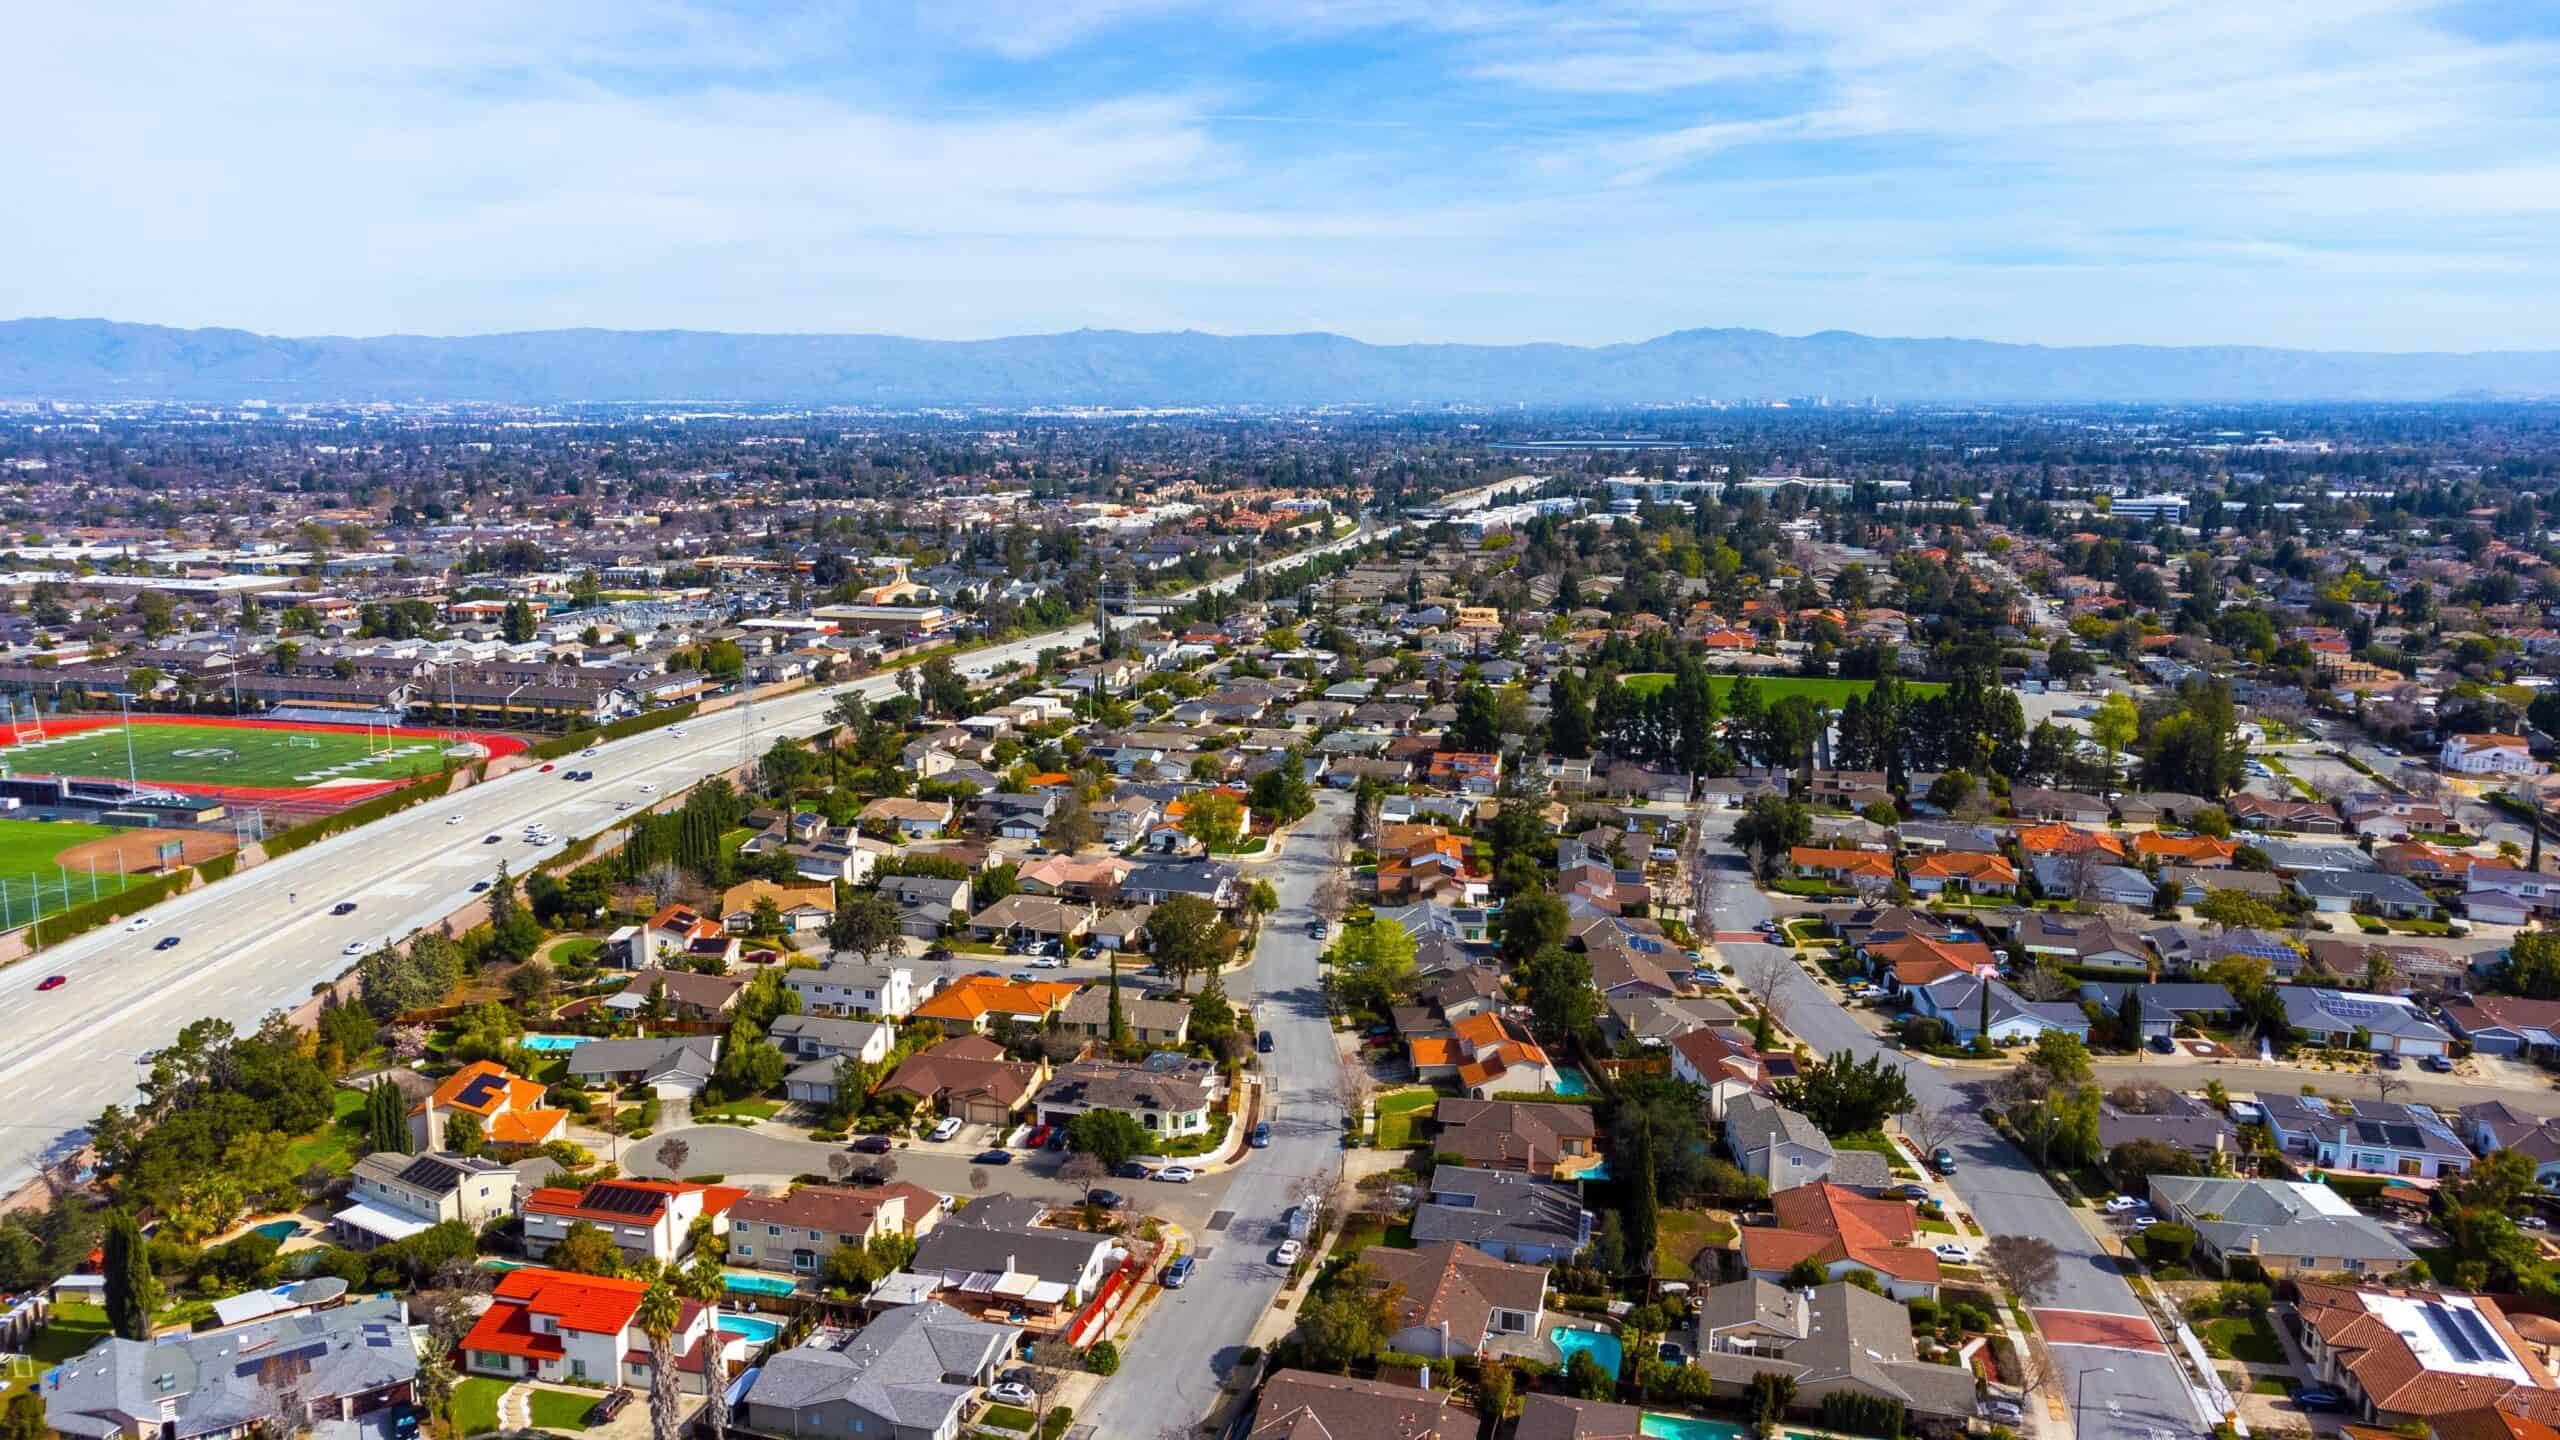
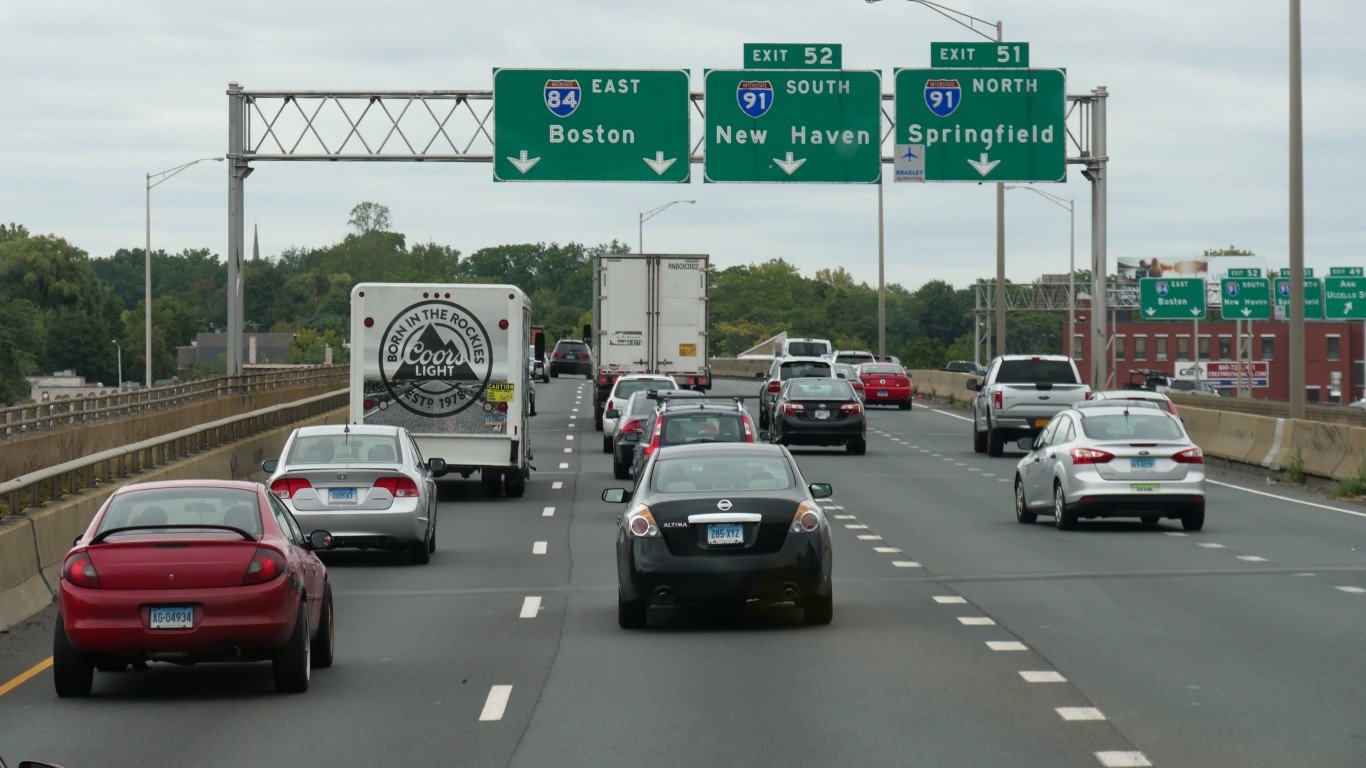
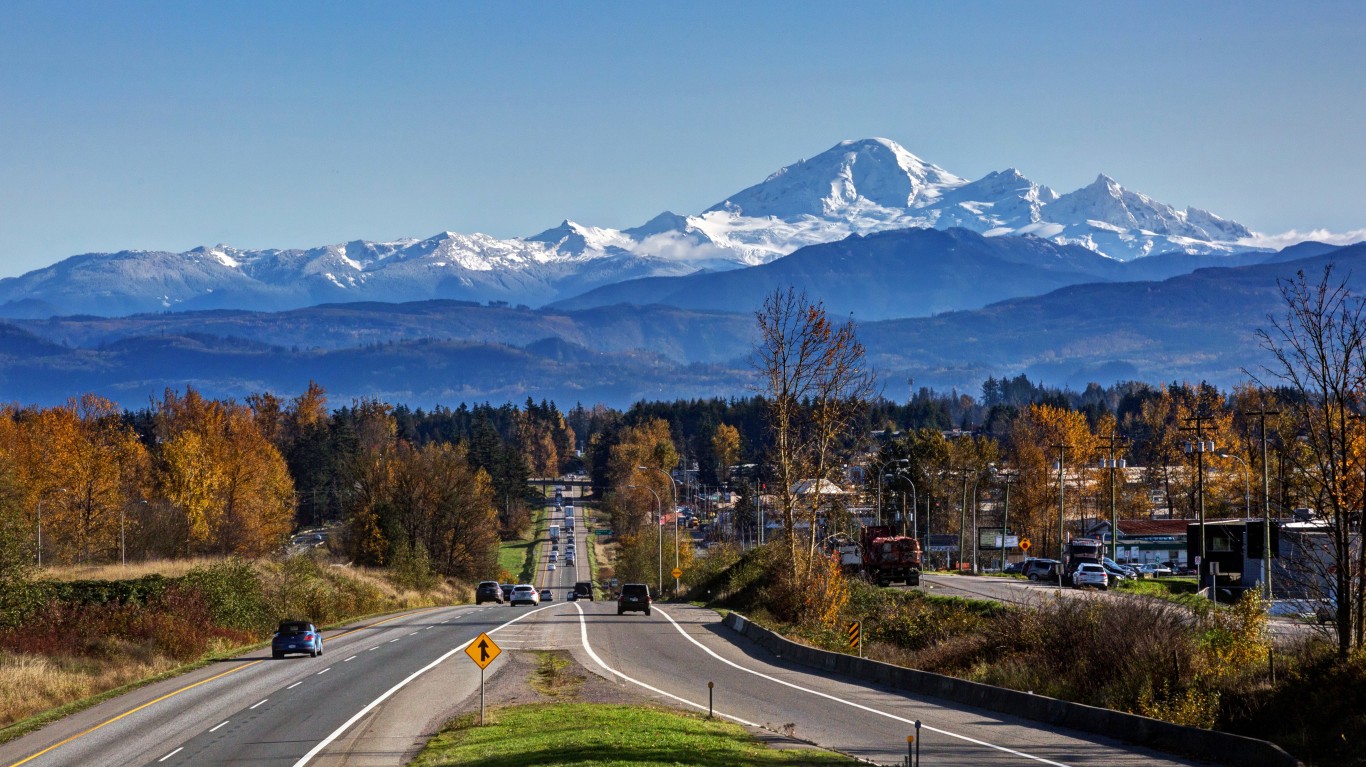
Among the five highest-ranking states are southern locations like Georgia, Tennessee, and North Carolina. Connecticut and Virginia are also in the top five. Conversely, the lowest-ranking states are spread out across the nation and include California, New York, Hawaii, Alaska, and Washington.
Why We Are Covering This
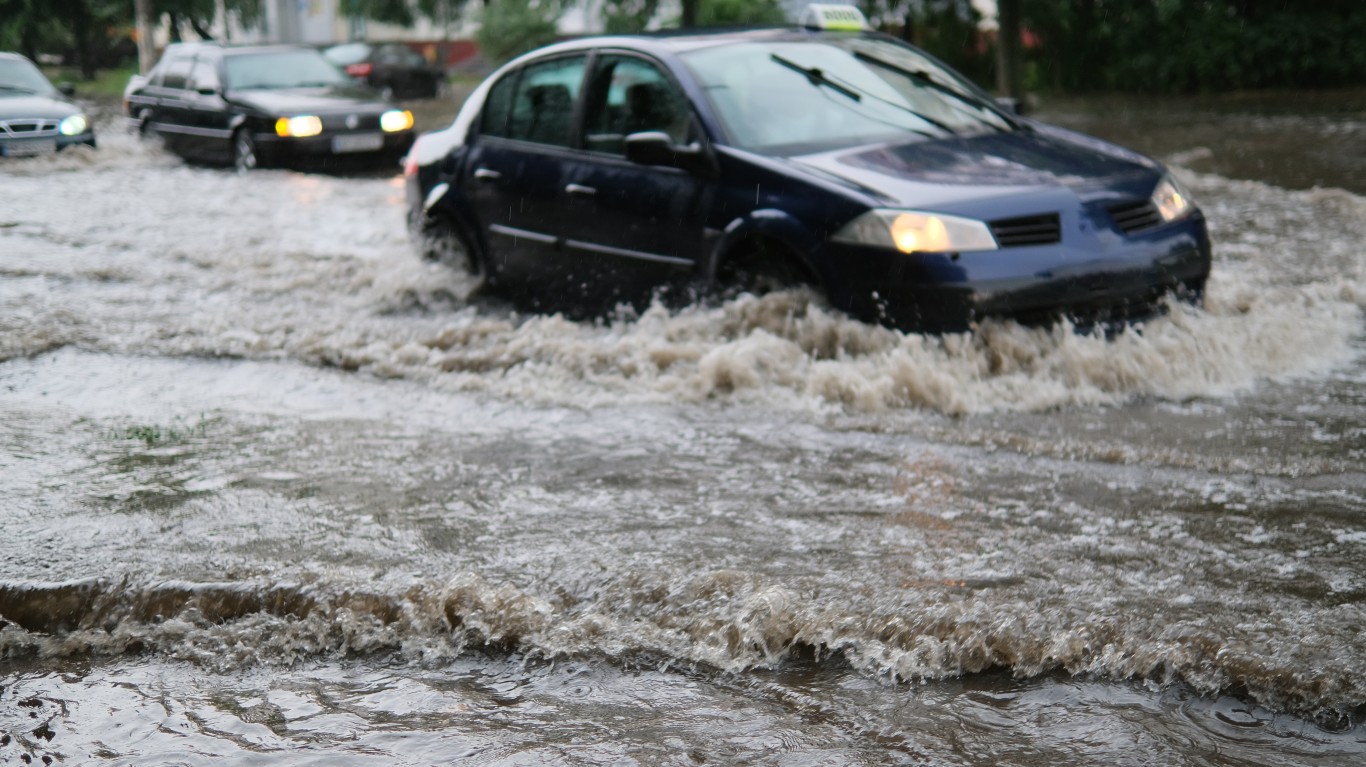
As climate change wreaks further havoc year after year, it becomes apparent that America’s infrastructure is not built to handle excessive heat, flooding, and other climate-related issues. San Francisco, which is projected to grow 37% wetter by the year 2100, is currently incapable of withstanding future climate damage. As flooding becomes more problematic, city officials realize infrastructure will crumble under worsening conditions.
Virginia — overall rank: 1
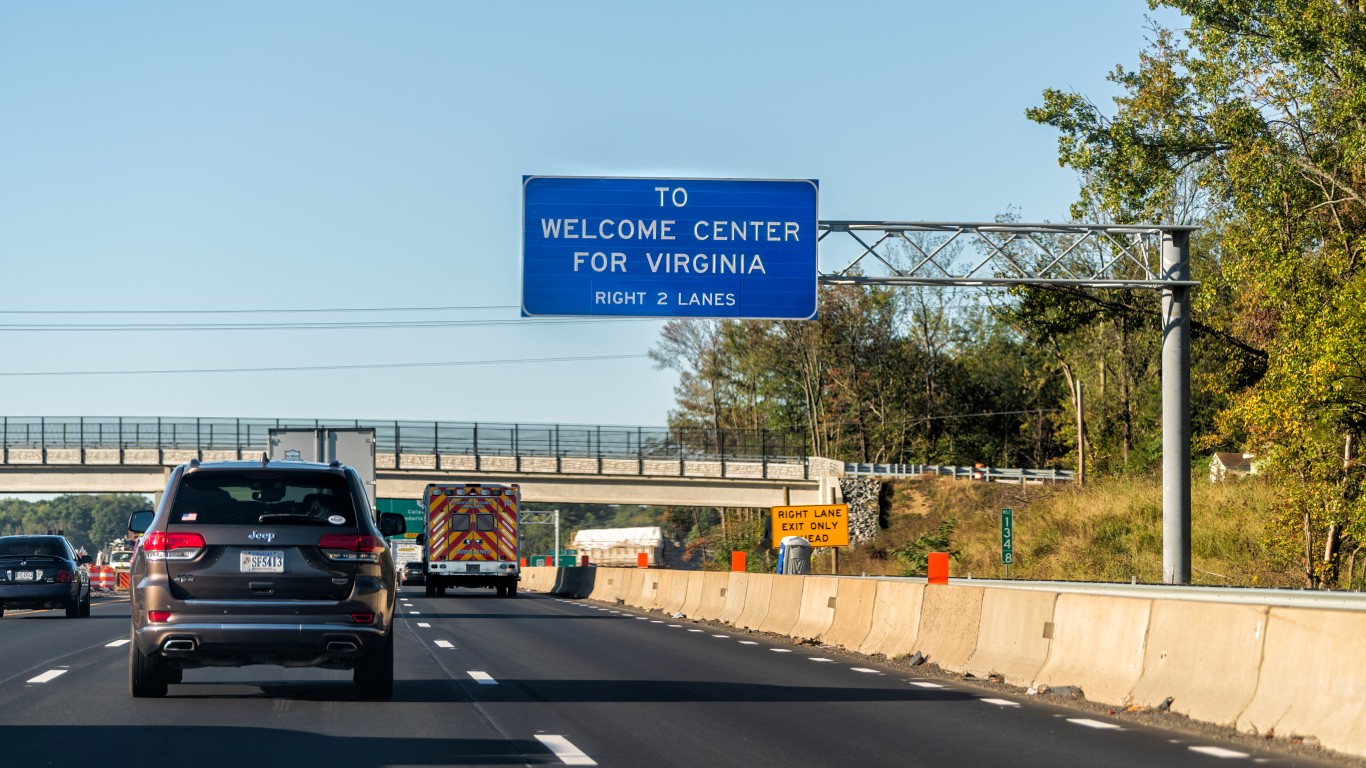
- Worst ranking category: Other fatality rate — category rank: 29
- Total disbursements per lane-mile: $34,870 — 8th Lowest
- Percent urban interstate mileage in poor condition: 2.57% — category rank: 19
- Percent rural interstate mileage in poor condition: 0.35% — category rank: 5
- Percent structurally deficient bridges: 3.79% — category rank: 10
- State-control highway miles: 128,989 — 3rd Highest
North Carolina — overall rank: 2
- Worst ranking category: Other fatality rate — category rank: 39
- Total disbursements per lane-mile: $41,126 — 15th Lowest
- Percent urban interstate mileage in poor condition: 2.27% — category rank: 15
- Percent rural interstate mileage in poor condition: 0.77% — category rank: 15
- Percent structurally deficient bridges: 7.02% — category rank: 30
- State-control highway miles: 173,653 — 2nd Highest
Tennessee — overall rank: 3
- Worst ranking category: Urban fatality rate — category rank: 47
- Total disbursements per lane-mile: $48,910 — 16th Lowest
- Percent urban interstate mileage in poor condition: 1.66% — category rank: 10
- Percent rural interstate mileage in poor condition: 0.67% — category rank: 12
- Percent structurally deficient bridges: 4.14% — category rank: 11
- State-control highway miles: 37,746 — 17th Highest
Georgia — overall rank: 4
- Worst ranking category: Urbanized area congestion — category rank: 40
- Total disbursements per lane-mile: $66,805 — 20th Lowest
- Percent urban interstate mileage in poor condition: 1.36% — category rank: 5
- Percent rural interstate mileage in poor condition: 0.91% — category rank: 18
- Percent structurally deficient bridges: 2.13% — category rank: 6
- State-control highway miles: 49,497 — 11th Highest
Connecticut — overall rank: 5
- Worst ranking category: Urbanized area congestion — category rank: 42
- Total disbursements per lane-mile: $205,881 — 8th Highest
- Percent urban interstate mileage in poor condition: 1.57% — category rank: 8
- Percent rural interstate mileage in poor condition: 0.73% — category rank: 13
- Percent structurally deficient bridges: 5.30% — category rank: 22
- State-control highway miles: 9,827 — 7th Lowest
South Carolina — overall rank: 6
- Worst ranking category: Rural fatality rate — category rank: 50
- Total disbursements per lane-mile: $27,474 — 3rd Lowest
- Percent urban interstate mileage in poor condition: 1.13% — category rank: 3
- Percent rural interstate mileage in poor condition: 0.95% — category rank: 19
- Percent structurally deficient bridges: 5.31% — category rank: 23
- State-control highway miles: 90,552 — 4th Highest
Kentucky — overall rank: 7
- Worst ranking category: Other fatality rate — category rank: 48
- Total disbursements per lane-mile: $36,139 — 11th Lowest
- Percent urban interstate mileage in poor condition: 2.32% — category rank: 16
- Percent rural interstate mileage in poor condition: 0.80% — category rank: 16
- Percent structurally deficient bridges: 6.87% — category rank: 26
- State-control highway miles: 62,346 — 8th Highest
Florida — overall rank: 8
- Worst ranking category: Urban fatality rate — category rank: 49
- Total disbursements per lane-mile: $241,859 — 4th Highest
- Percent urban interstate mileage in poor condition: 1.59% — category rank: 9
- Percent rural interstate mileage in poor condition: 0.15% — category rank: 1
- Percent structurally deficient bridges: 3.62% — category rank: 8
- State-control highway miles: 45,013 — 12th Highest
North Dakota — overall rank: 9
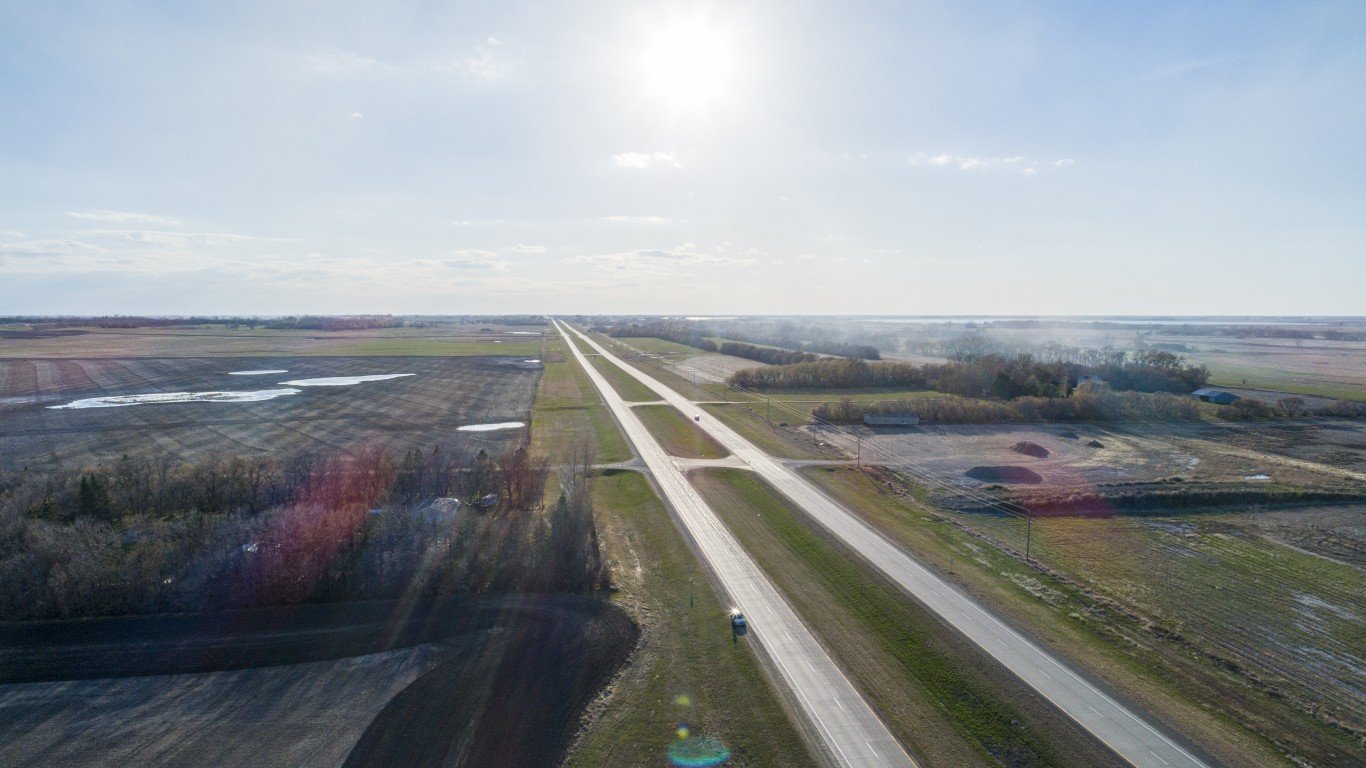
- Worst ranking category: Structurally deficient bridges — category rank: 43
- Total disbursements per lane-mile: $26,932 — 2nd Lowest
- Percent urban interstate mileage in poor condition: 0.98% — category rank: 2
- Percent rural interstate mileage in poor condition: 0.38% — category rank: 7
- Percent structurally deficient bridges: 11.23% — category rank: 43
- State-control highway miles: 17,245 — 15th Lowest
Utah — overall rank: 10
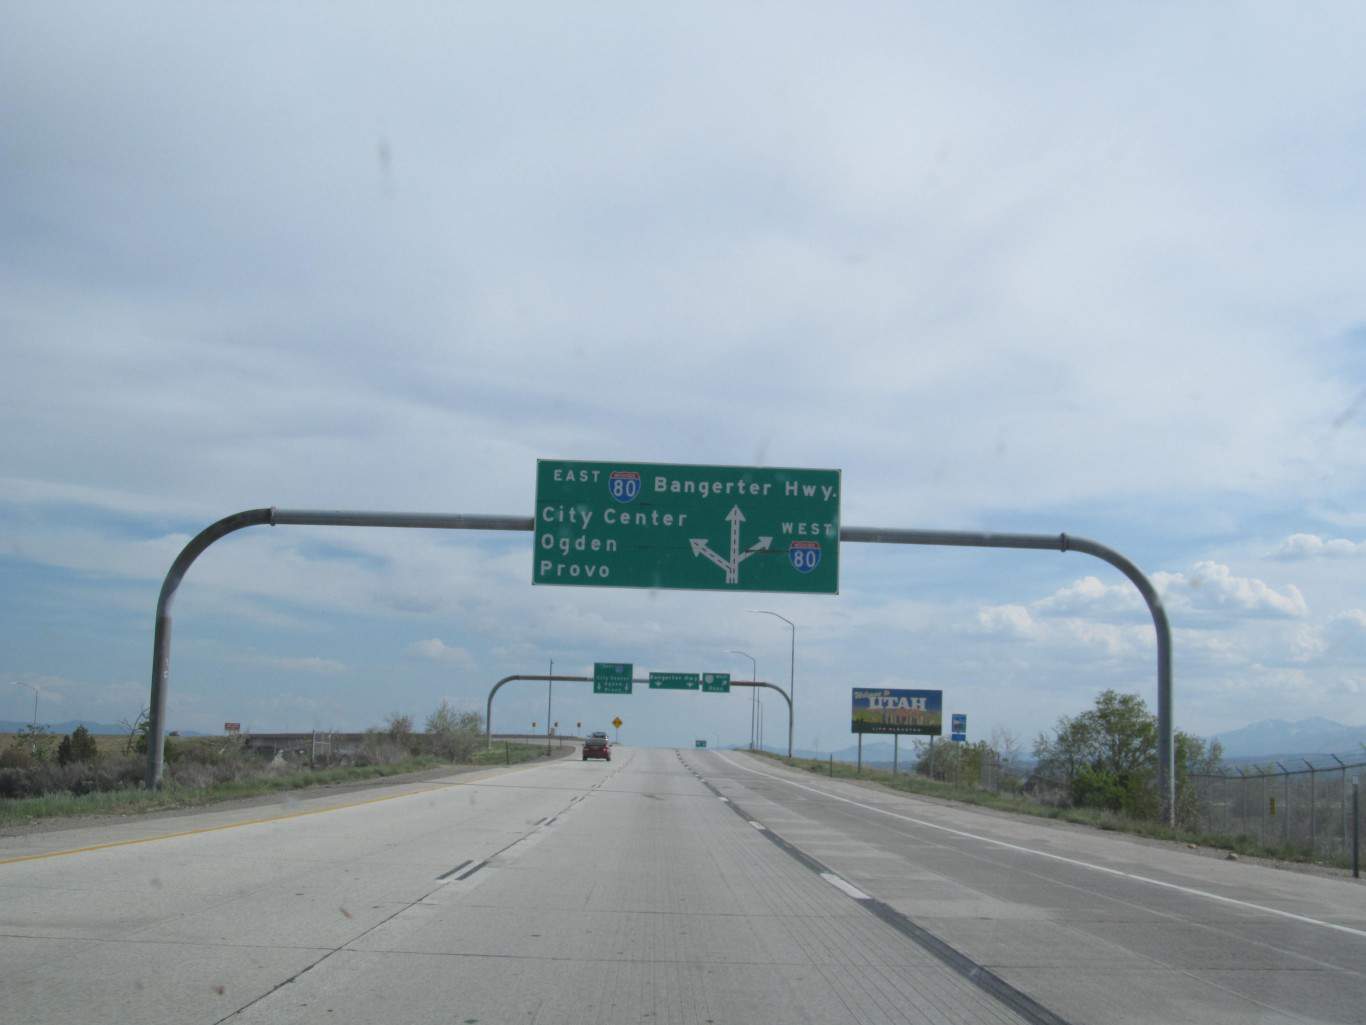
- Worst ranking category: Other disbursements ratio — category rank: 47
- Total disbursements per lane-mile: $104,697 — 15th Highest
- Percent urban interstate mileage in poor condition: 2.69% — category rank: 20
- Percent rural interstate mileage in poor condition: 0.30% — category rank: 4
- Percent structurally deficient bridges: 2.06% — category rank: 5
- State-control highway miles: 16,023 — 14th Lowest
Missouri — overall rank: 11
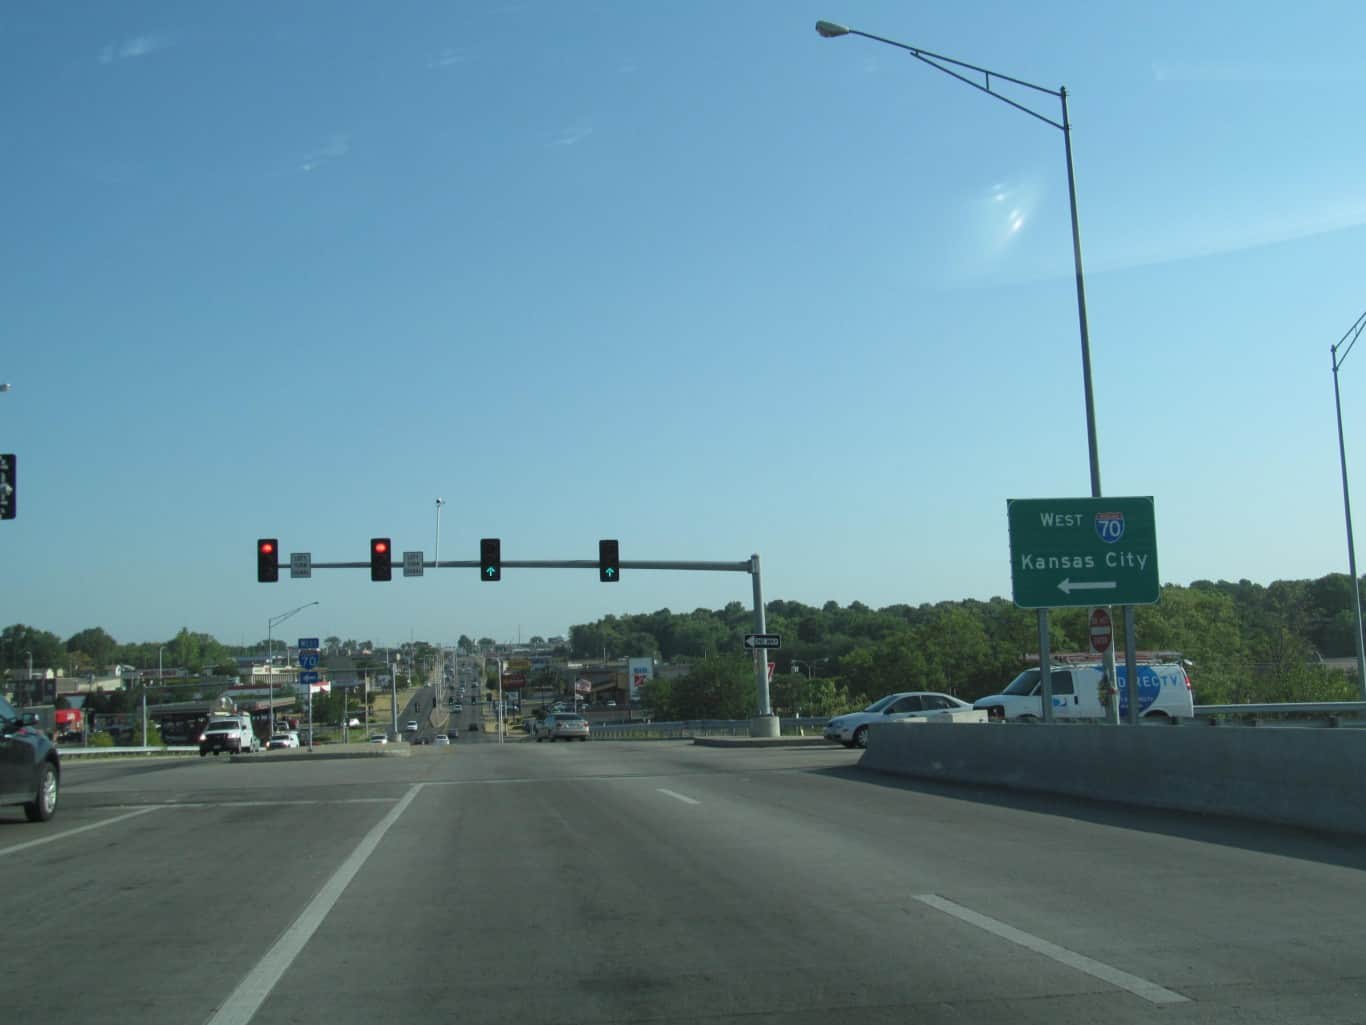
- Worst ranking category: Urban fatality rate — category rank: 42
- Total disbursements per lane-mile: $27,773 — 5th Lowest
- Percent urban interstate mileage in poor condition: 3.03% — category rank: 24
- Percent rural interstate mileage in poor condition: 0.55% — category rank: 9
- Percent structurally deficient bridges: 9.02% — category rank: 39
- State-control highway miles: 77,693 — 6th Highest
Minnesota — overall rank: 12
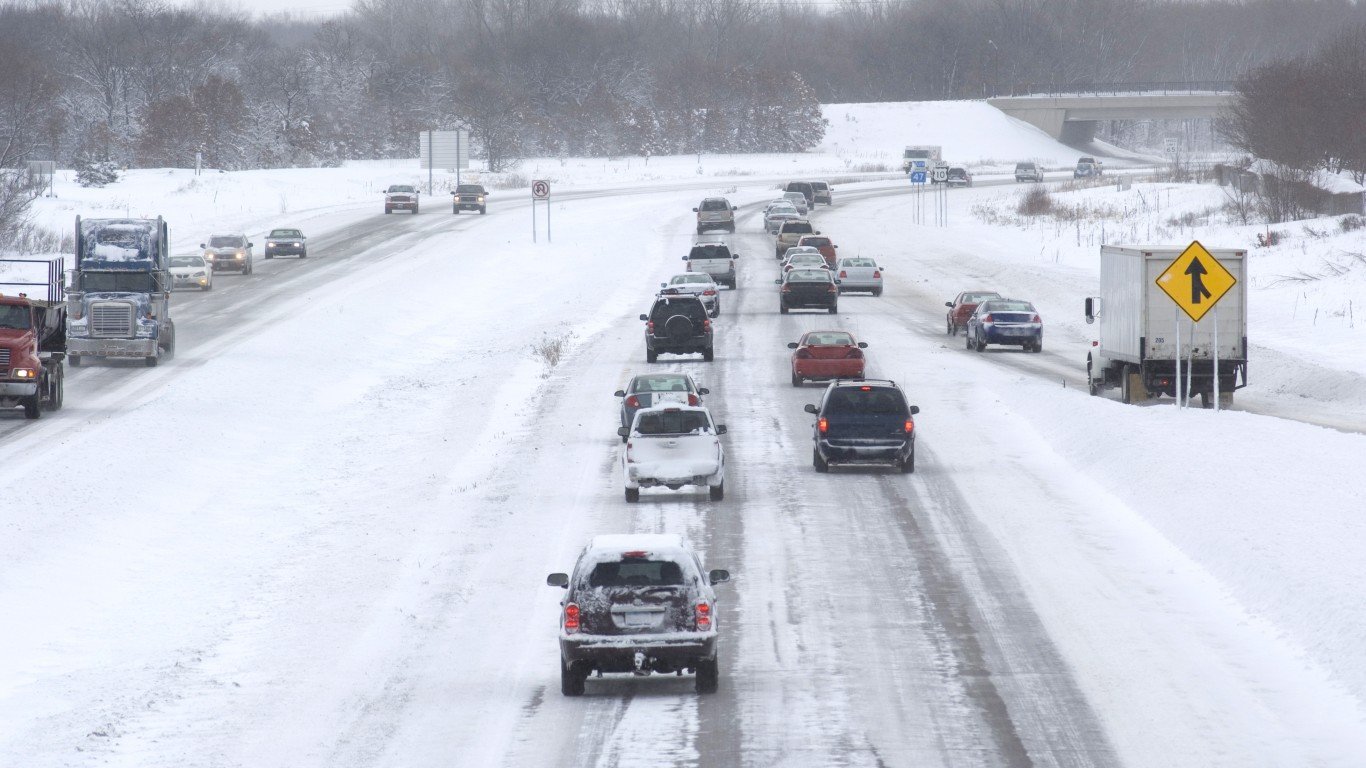
- Worst ranking category: Maintenance disbursements ratio — category rank: 40
- Total disbursements per lane-mile: $80,690 — 24th Highest
- Percent urban interstate mileage in poor condition: 3.20% — category rank: 27
- Percent rural interstate mileage in poor condition: 0.89% — category rank: 17
- Percent structurally deficient bridges: 4.58% — category rank: 12
- State-control highway miles: 29,176 — 22nd Highest
Arkansas — overall rank: 13
- Worst ranking category: Rural interstate pavement condition — category rank: 37
- Total disbursements per lane-mile: $35,367 — 9th Lowest
- Percent urban interstate mileage in poor condition: 5.13% — category rank: 35
- Percent rural interstate mileage in poor condition: 2.65% — category rank: 37
- Percent structurally deficient bridges: 5.25% — category rank: 20
- State-control highway miles: 38,078 — 16th Highest
New Hampshire — overall rank: 14

- Worst ranking category: Admin disbursements ratio — category rank: 45
- Total disbursements per lane-mile: $70,952 — 22nd Lowest
- Percent urban interstate mileage in poor condition: 0.16% — category rank: 1
- Percent rural interstate mileage in poor condition: 0.35% — category rank: 6
- Percent structurally deficient bridges: 7.68% — category rank: 34
- State-control highway miles: 8,453 — 4th Lowest
Alabama — overall rank: 15
- Worst ranking category: Admin disbursements ratio — category rank: 42
- Total disbursements per lane-mile: $73,783 — 23rd Lowest
- Percent urban interstate mileage in poor condition: 5.16% — category rank: 36
- Percent rural interstate mileage in poor condition: 1.49% — category rank: 28
- Percent structurally deficient bridges: 3.63% — category rank: 9
- State-control highway miles: 29,707 — 20th Highest
Wyoming — overall rank: 16
- Worst ranking category: Urban fatality rate — category rank: 44
- Total disbursements per lane-mile: $35,737 — 10th Lowest
- Percent urban interstate mileage in poor condition: 6.70% — category rank: 41
- Percent rural interstate mileage in poor condition: 1.58% — category rank: 31
- Percent structurally deficient bridges: 7.39% — category rank: 32
- State-control highway miles: 15,792 — 13th Lowest
Ohio — overall rank: 17
- Worst ranking category: Urban other principal arterial pavement condition — category rank: 39
- Total disbursements per lane-mile: $80,329 — 25th Highest
- Percent urban interstate mileage in poor condition: 4.56% — category rank: 32
- Percent rural interstate mileage in poor condition: 2.17% — category rank: 33
- Percent structurally deficient bridges: 4.91% — category rank: 16
- State-control highway miles: 49,681 — 10th Highest
Mississippi — overall rank: 18
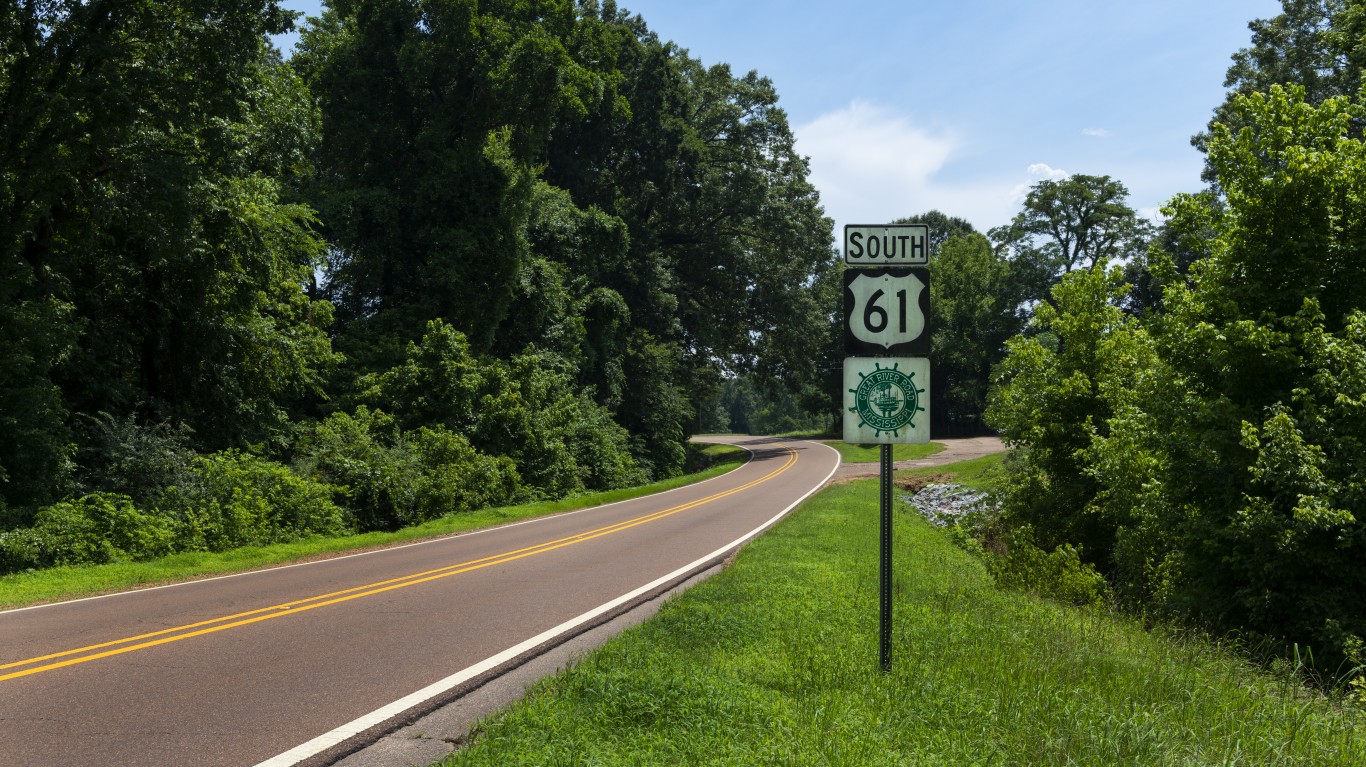
- Worst ranking category: Other fatality rate — category rank: 49
- Total disbursements per lane-mile: $36,425 — 13th Lowest
- Percent urban interstate mileage in poor condition: 3.13% — category rank: 26
- Percent rural interstate mileage in poor condition: 1.49% — category rank: 29
- Percent structurally deficient bridges: 6.99% — category rank: 29
- State-control highway miles: 28,310 — 24th Highest
Texas — overall rank: 19

- Worst ranking category: Urbanized area congestion — category rank: 47
- Total disbursements per lane-mile: $74,921 — 24th Lowest
- Percent urban interstate mileage in poor condition: 3.97% — category rank: 30
- Percent rural interstate mileage in poor condition: 1.24% — category rank: 22
- Percent structurally deficient bridges: 1.43% — category rank: 3
- State-control highway miles: 198,465 — the Highest
Massachusetts — overall rank: 20
- Worst ranking category: Urbanized area congestion — category rank: 48
- Total disbursements per lane-mile: $346,370 — 3rd Highest
- Percent urban interstate mileage in poor condition: 2.99% — category rank: 23
- Percent rural interstate mileage in poor condition: 1.04% — category rank: 20
- Percent structurally deficient bridges: 8.69% — category rank: 37
- State-control highway miles: 9,556 — 6th Lowest
Nevada — overall rank: 21

- Worst ranking category: Rural fatality rate — category rank: 48
- Total disbursements per lane-mile: $90,024 — 20th Highest
- Percent urban interstate mileage in poor condition: 2.48% — category rank: 17
- Percent rural interstate mileage in poor condition: 0.18% — category rank: 2
- Percent structurally deficient bridges: 1.40% — category rank: 2
- State-control highway miles: 13,509 — 11th Lowest
Kansas — overall rank: 22
- Worst ranking category: Other disbursements ratio — category rank: 48
- Total disbursements per lane-mile: $50,211 — 18th Lowest
- Percent urban interstate mileage in poor condition: 3.08% — category rank: 25
- Percent rural interstate mileage in poor condition: 0.74% — category rank: 14
- Percent structurally deficient bridges: 5.12% — category rank: 17
- State-control highway miles: 24,037 — 24th Lowest
Indiana — overall rank: 23
- Worst ranking category: Maintenance disbursements ratio — category rank: 48
- Total disbursements per lane-mile: $95,146 — 18th Highest
- Percent urban interstate mileage in poor condition: 4.24% — category rank: 31
- Percent rural interstate mileage in poor condition: 2.76% — category rank: 39
- Percent structurally deficient bridges: 5.60% — category rank: 24
- State-control highway miles: 28,445 — 23rd Highest
Maryland — overall rank: 24
- Worst ranking category: Urban interstate pavement condition — category rank: 42
- Total disbursements per lane-mile: $213,604 — 6th Highest
- Percent urban interstate mileage in poor condition: 6.94% — category rank: 42
- Percent rural interstate mileage in poor condition: 1.24% — category rank: 23
- Percent structurally deficient bridges: 4.65% — category rank: 14
- State-control highway miles: 14,928 — 12th Lowest
Montana — overall rank: 25

- Worst ranking category: Rural fatality rate — category rank: 47
- Total disbursements per lane-mile: $31,102 — 6th Lowest
- Percent urban interstate mileage in poor condition: 1.74% — category rank: 13
- Percent rural interstate mileage in poor condition: 1.32% — category rank: 25
- Percent structurally deficient bridges: 6.93% — category rank: 28
- State-control highway miles: 25,211 — 25th Lowest
Nebraska — overall rank: 26
- Worst ranking category: Urban other principal arterial pavement condition — category rank: 48
- Total disbursements per lane-mile: $36,202 — 12th Lowest
- Percent urban interstate mileage in poor condition: 3.85% — category rank: 29
- Percent rural interstate mileage in poor condition: 0.62% — category rank: 10
- Percent structurally deficient bridges: 8.34% — category rank: 36
- State-control highway miles: 22,541 — 21st Lowest
Michigan — overall rank: 27
- Worst ranking category: Urban interstate pavement condition — category rank: 43
- Total disbursements per lane-mile: $92,566 — 19th Highest
- Percent urban interstate mileage in poor condition: 7.79% — category rank: 43
- Percent rural interstate mileage in poor condition: 3.00% — category rank: 41
- Percent structurally deficient bridges: 10.99% — category rank: 42
- State-control highway miles: 27,366 — 25th Highest
South Dakota — overall rank: 28
- Worst ranking category: Structurally deficient bridges — category rank: 47
- Total disbursements per lane-mile: $27,628 — 4th Lowest
- Percent urban interstate mileage in poor condition: 1.14% — category rank: 4
- Percent rural interstate mileage in poor condition: 0.44% — category rank: 8
- Percent structurally deficient bridges: 17.30% — category rank: 47
- State-control highway miles: 17,955 — 17th Lowest
Illinois — overall rank: 29
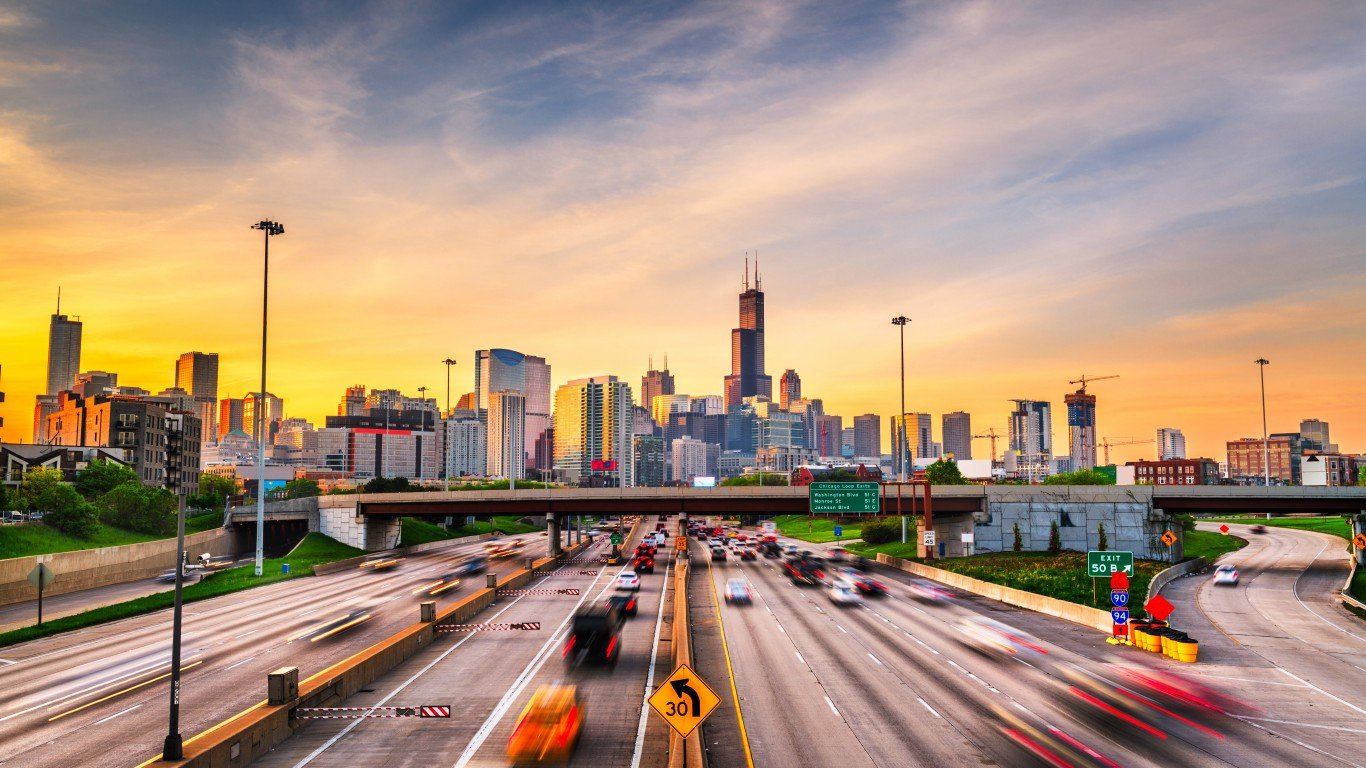
- Worst ranking category: Urbanized area congestion — category rank: 45
- Total disbursements per lane-mile: $123,480 — 12th Highest
- Percent urban interstate mileage in poor condition: 4.82% — category rank: 34
- Percent rural interstate mileage in poor condition: 1.34% — category rank: 26
- Percent structurally deficient bridges: 8.96% — category rank: 38
- State-control highway miles: 42,169 — 13th Highest
Arizona — overall rank: 30
- Worst ranking category: Urban fatality rate — category rank: 48
- Total disbursements per lane-mile: $107,607 — 14th Highest
- Percent urban interstate mileage in poor condition: 2.13% — category rank: 14
- Percent rural interstate mileage in poor condition: 2.22% — category rank: 34
- Percent structurally deficient bridges: 1.38% — category rank: 1
- State-control highway miles: 20,046 — 20th Lowest
Iowa — overall rank: 31
- Worst ranking category: Structurally deficient bridges — category rank: 49
- Total disbursements per lane-mile: $63,391 — 19th Lowest
- Percent urban interstate mileage in poor condition: 4.72% — category rank: 33
- Percent rural interstate mileage in poor condition: 1.55% — category rank: 30
- Percent structurally deficient bridges: 18.87% — category rank: 49
- State-control highway miles: 22,918 — 22nd Lowest
Maine — overall rank: 32
- Worst ranking category: Rural other principal arterial pavement condition — category rank: 47
- Total disbursements per lane-mile: $49,234 — 17th Lowest
- Percent urban interstate mileage in poor condition: 1.43% — category rank: 7
- Percent rural interstate mileage in poor condition: 1.39% — category rank: 27
- Percent structurally deficient bridges: 12.64% — category rank: 44
- State-control highway miles: 17,467 — 16th Lowest
Wisconsin — overall rank: 33
- Worst ranking category: Urban other principal arterial pavement condition — category rank: 43
- Total disbursements per lane-mile: $85,189 — 22nd Highest
- Percent urban interstate mileage in poor condition: 5.23% — category rank: 37
- Percent rural interstate mileage in poor condition: 2.63% — category rank: 36
- Percent structurally deficient bridges: 6.90% — category rank: 27
- State-control highway miles: 29,806 — 19th Highest
Idaho — overall rank: 34

- Worst ranking category: Capital & bridge disbursements ratio — category rank: 48
- Total disbursements per lane-mile: $68,714 — 21st Lowest
- Percent urban interstate mileage in poor condition: 1.66% — category rank: 11
- Percent rural interstate mileage in poor condition: 2.08% — category rank: 32
- Percent structurally deficient bridges: 5.22% — category rank: 19
- State-control highway miles: 12,272 — 10th Lowest
Delaware — overall rank: 35
- Worst ranking category: Admin disbursements ratio — category rank: 49
- Total disbursements per lane-mile: $148,392 — 11th Highest
- Percent urban interstate mileage in poor condition: 8.67% — category rank: 44
- Percent rural interstate mileage in poor condition: N/A
- Percent structurally deficient bridges: 1.94% — category rank: 4
- State-control highway miles: 11,998 — 9th Lowest
New Mexico — overall rank: 36
- Worst ranking category: Urban fatality rate — category rank: 50
- Total disbursements per lane-mile: $33,130 — 7th Lowest
- Percent urban interstate mileage in poor condition: 3.57% — category rank: 28
- Percent rural interstate mileage in poor condition: 2.81% — category rank: 40
- Percent structurally deficient bridges: 5.17% — category rank: 18
- State-control highway miles: 29,430 — 21st Highest
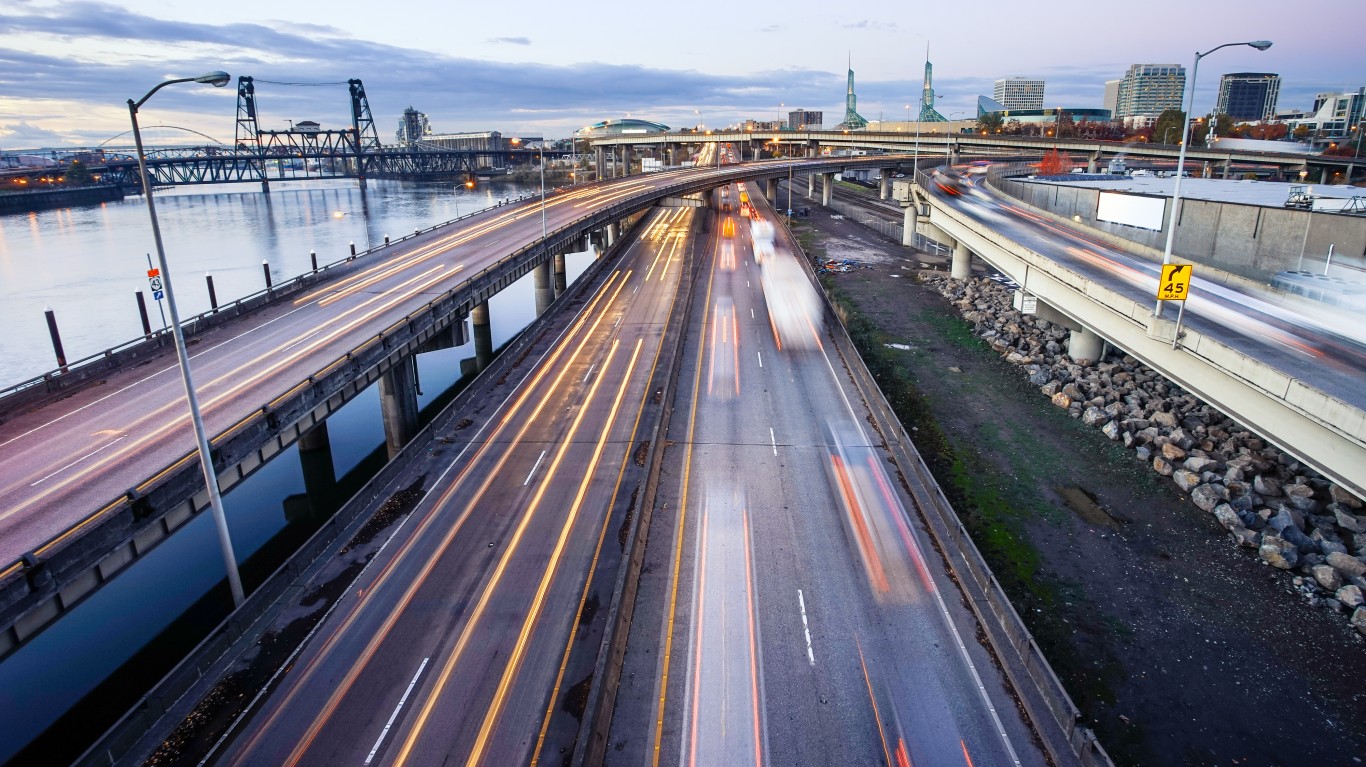
Oregon — overall rank: 37

- Worst ranking category: Other disbursements ratio — category rank: 49
- Total disbursements per lane-mile: $108,401 — 13th Highest
- Percent urban interstate mileage in poor condition: 2.88% — category rank: 21
- Percent rural interstate mileage in poor condition: 0.66% — category rank: 11
- Percent structurally deficient bridges: 4.64% — category rank: 13
- State-control highway miles: 18,460 — 18th Lowest
Vermont — overall rank: 38
- Worst ranking category: Admin disbursements ratio — category rank: 50
- Total disbursements per lane-mile: $78,884 — 25th Lowest
- Percent urban interstate mileage in poor condition: 1.37% — category rank: 6
- Percent rural interstate mileage in poor condition: 1.14% — category rank: 21
- Percent structurally deficient bridges: 2.40% — category rank: 7
- State-control highway miles: 5,998 — 3rd Lowest
West Virginia — overall rank: 39
- Worst ranking category: Structurally deficient bridges — category rank: 50
- Total disbursements per lane-mile: $20,882 — the Lowest
- Percent urban interstate mileage in poor condition: 8.99% — category rank: 45
- Percent rural interstate mileage in poor condition: 3.44% — category rank: 44
- Percent structurally deficient bridges: 20.37% — category rank: 50
- State-control highway miles: 71,054 — 7th Highest
Louisiana — overall rank: 40
- Worst ranking category: Urban interstate pavement condition — category rank: 49
- Total disbursements per lane-mile: $40,641 — 14th Lowest
- Percent urban interstate mileage in poor condition: 11.99% — category rank: 49
- Percent rural interstate mileage in poor condition: 3.07% — category rank: 43
- Percent structurally deficient bridges: 12.76% — category rank: 45
- State-control highway miles: 40,154 — 14th Highest
Pennsylvania — overall rank: 41
- Worst ranking category: Structurally deficient bridges — category rank: 46
- Total disbursements per lane-mile: $102,258 — 16th Highest
- Percent urban interstate mileage in poor condition: 6.13% — category rank: 39
- Percent rural interstate mileage in poor condition: 3.03% — category rank: 42
- Percent structurally deficient bridges: 13.80% — category rank: 46
- State-control highway miles: 88,322 — 5th Highest
Rhode Island — overall rank: 42
- Worst ranking category: Rural other principal arterial pavement condition — category rank: 49
- Total disbursements per lane-mile: $220,035 — 5th Highest
- Percent urban interstate mileage in poor condition: 2.49% — category rank: 18
- Percent rural interstate mileage in poor condition: 0.27% — category rank: 3
- Percent structurally deficient bridges: 17.46% — category rank: 48
- State-control highway miles: 2,870 — 2nd Lowest
Colorado — overall rank: 43
- Worst ranking category: Rural interstate pavement condition — category rank: 47
- Total disbursements per lane-mile: $84,343 — 23rd Highest
- Percent urban interstate mileage in poor condition: 6.64% — category rank: 40
- Percent rural interstate mileage in poor condition: 8.32% — category rank: 47
- Percent structurally deficient bridges: 5.29% — category rank: 21
- State-control highway miles: 23,022 — 23rd Lowest
New Jersey — overall rank: 44
- Worst ranking category: Urbanized area congestion — category rank: 50
- Total disbursements per lane-mile: $1,137,815 — the Highest
- Percent urban interstate mileage in poor condition: 9.32% — category rank: 46
- Percent rural interstate mileage in poor condition: 1.29% — category rank: 24
- Percent structurally deficient bridges: 7.09% — category rank: 31
- State-control highway miles: 8,551 — 5th Lowest
Oklahoma — overall rank: 45
- Worst ranking category: Maintenance disbursements ratio — category rank: 45
- Total disbursements per lane-mile: $88,624 — 21st Highest
- Percent urban interstate mileage in poor condition: 5.42% — category rank: 38
- Percent rural interstate mileage in poor condition: 2.36% — category rank: 35
- Percent structurally deficient bridges: 9.89% — category rank: 41
- State-control highway miles: 30,407 — 18th Highest
Washington — overall rank: 46
- Worst ranking category: Capital & bridge disbursement ratio — category rank: 50
- Total disbursements per lane-mile: $202,793 — 9th Highest
- Percent urban interstate mileage in poor condition: 2.92% — category rank: 22
- Percent rural interstate mileage in poor condition: 4.10% — category rank: 45
- Percent structurally deficient bridges: 4.80% — category rank: 15
- State-control highway miles: 18,450 — 19th Lowest
California — overall rank: 47
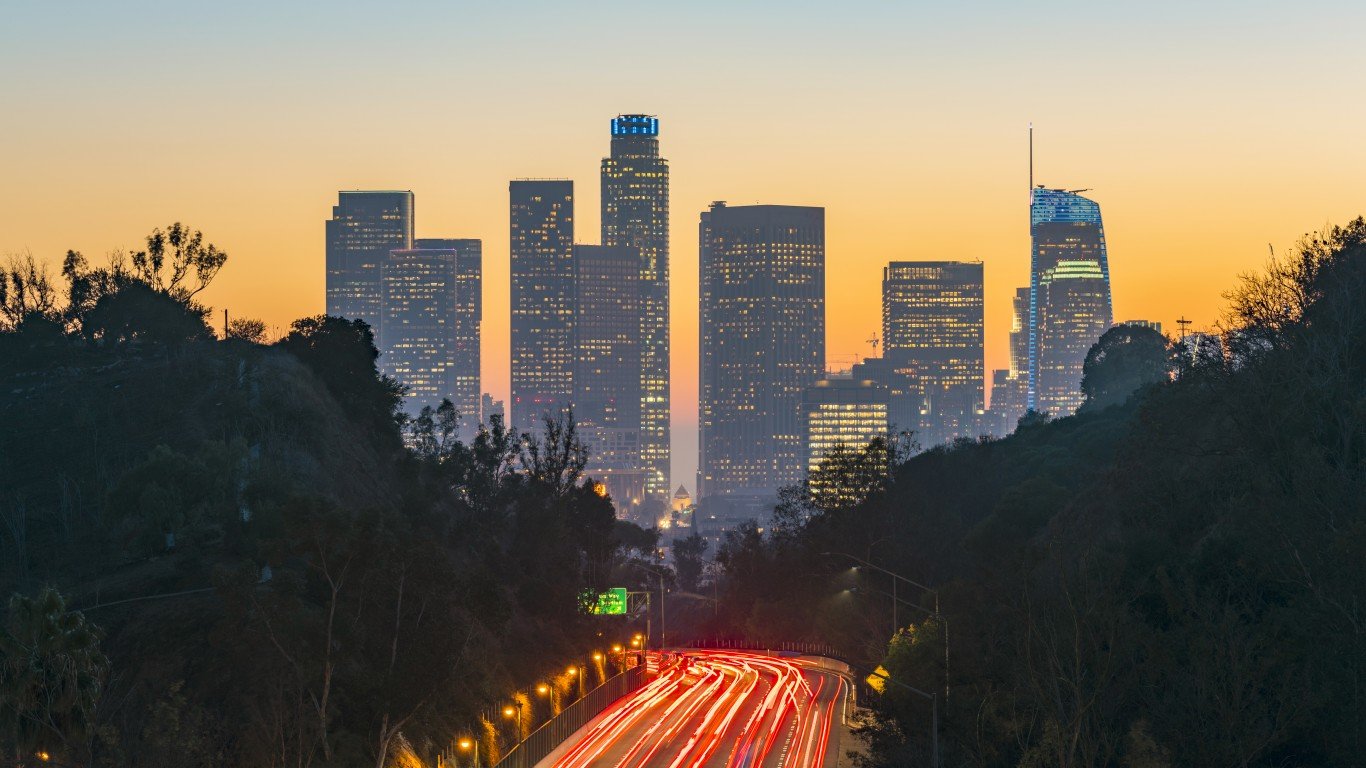
- Worst ranking category: Urban other principal arterial pavement condition — category rank: 50
- Total disbursements per lane-mile: $207,482 — 7th Highest
- Percent urban interstate mileage in poor condition: 9.38% — category rank: 47
- Percent rural interstate mileage in poor condition: 4.52% — category rank: 46
- Percent structurally deficient bridges: 5.80% — category rank: 25
- State-control highway miles: 52,004 — 9th Highest
Hawaii — overall rank: 48
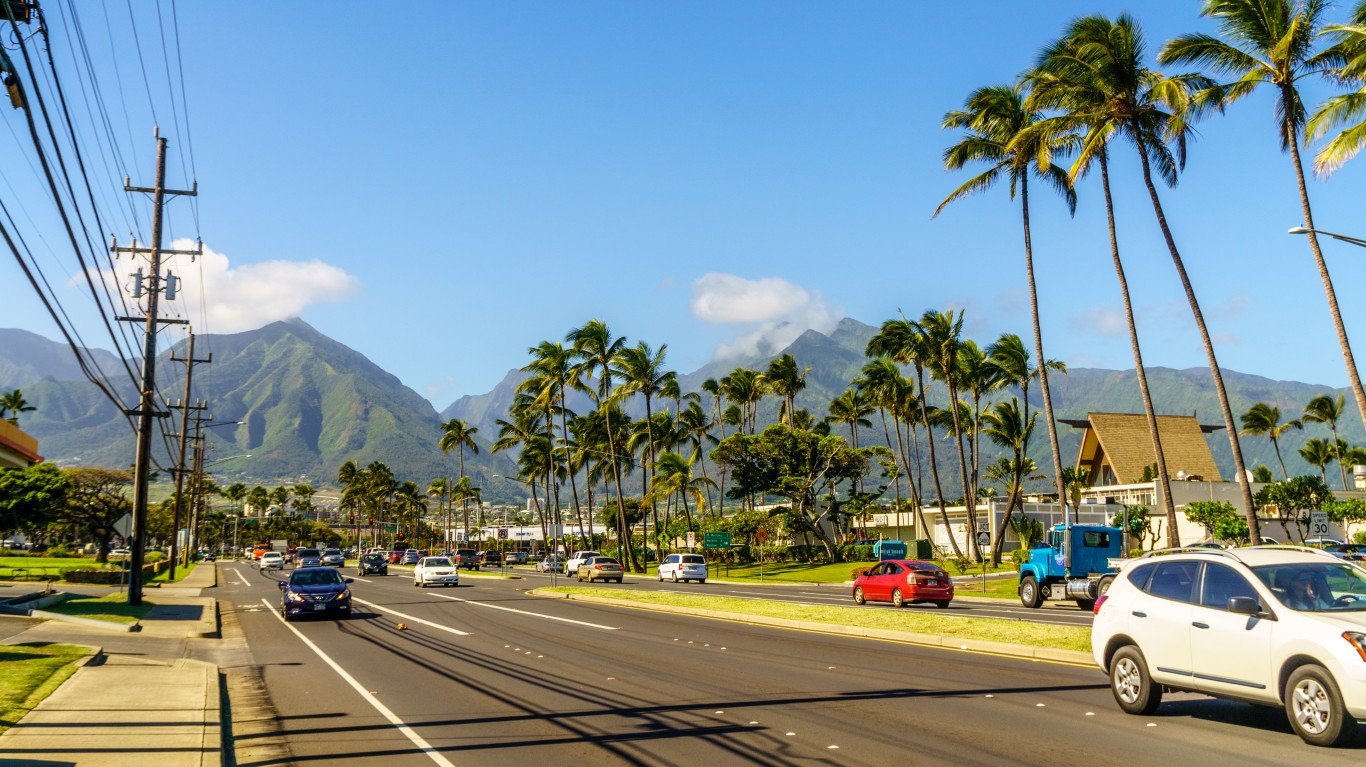
- Worst ranking category: Urban interstate pavement condition — category rank: 50
- Total disbursements per lane-mile: $155,395 — 10th Highest
- Percent urban interstate mileage in poor condition: 25.88% — category rank: 50
- Percent rural interstate mileage in poor condition: N/A
- Percent structurally deficient bridges: 7.49% — category rank: 33
- State-control highway miles: 2,477 — the Lowest
New York — overall rank: 49
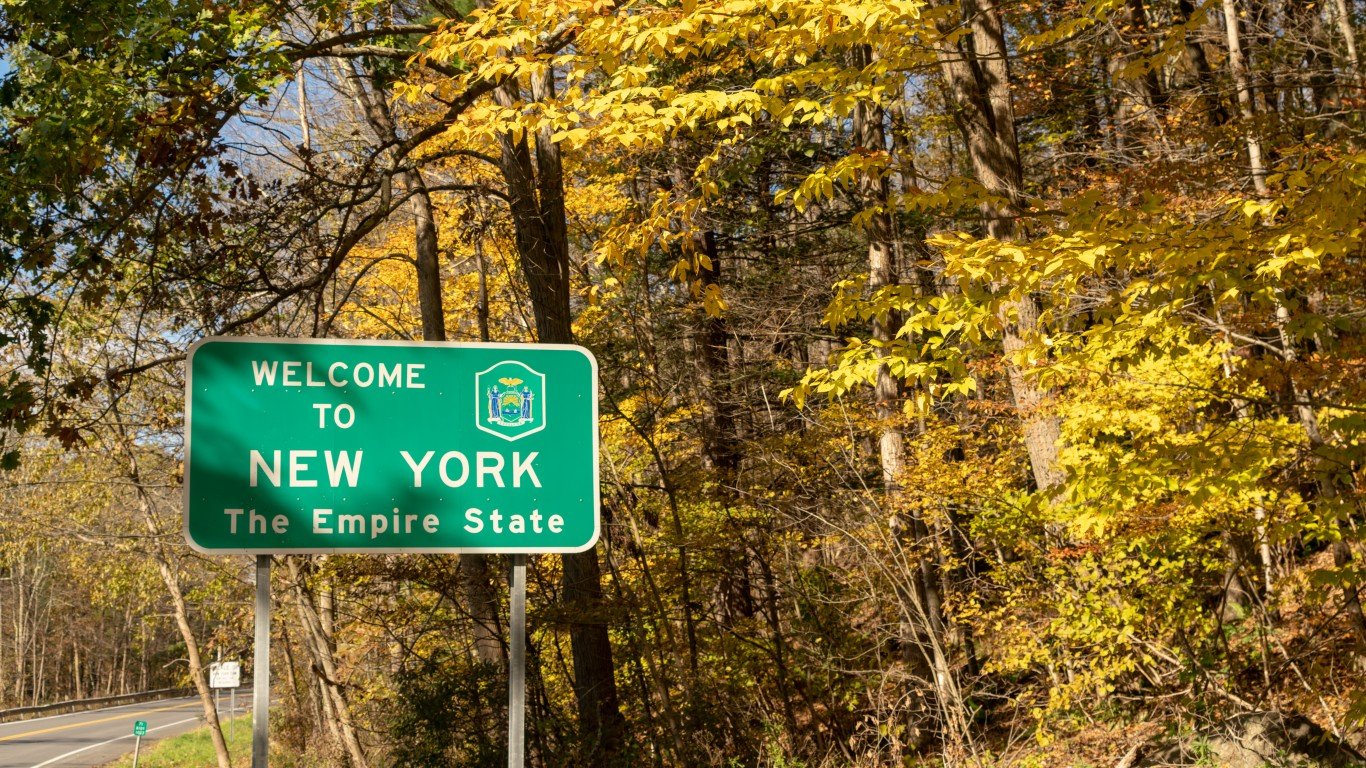
- Worst ranking category: Other disbursements ratio — category rank: 50
- Total disbursements per lane-mile: $374,937 — 2nd Highest
- Percent urban interstate mileage in poor condition: 9.39% — category rank: 48
- Percent rural interstate mileage in poor condition: 2.73% — category rank: 38
- Percent structurally deficient bridges: 9.52% — category rank: 40
- State-control highway miles: 38,157 — 15th Highest
Alaska — overall rank: 50

- Worst ranking category: Rural other principal arterial pavement condition — category rank: 50
- Total disbursements per lane-mile: $98,583 — 17th Highest
- Percent urban interstate mileage in poor condition: 1.69% — category rank: 12
- Percent rural interstate mileage in poor condition: 9.63% — category rank: 48
- Percent structurally deficient bridges: 8.21% — category rank: 35
- State-control highway miles: 11,754 — 8th Lowest
Contact [email protected] for any questions or corrections.