Several bridge closures and collapses made the news in the past year. For example, the Washington Bridge in East Providence, Rhode Island, was closed in December following an inspection that revealed damages. Similarly, the Route 20 bridge over Twenty Mile Creek in North East Township, Pennsylvania was closed due to safety concerns in January. And in southern Montana, a bridge collapsed and a train carrying hazardous materials derailed into a river last June. Of course, how safe bridges are differs by state.
To find the state with the worst bridges in America, 24/7 Wall St. reviewed Libertarian Reason Foundation’s 27th Annual Highway Report, listing the states by their percentage of structurally deficient bridges, ranking from the lowest to the highest percentage. The overall rank of the state’s highway system is from 1 — the best, to 50 — the worst and is a measure of 13 categories, including urban and rural pavement condition, deficient bridges, traffic fatalities, spending per mile, and administrative costs per mile of highway. All data is from the report except for each state’s most impressive bridge, which came from Love Exploring.
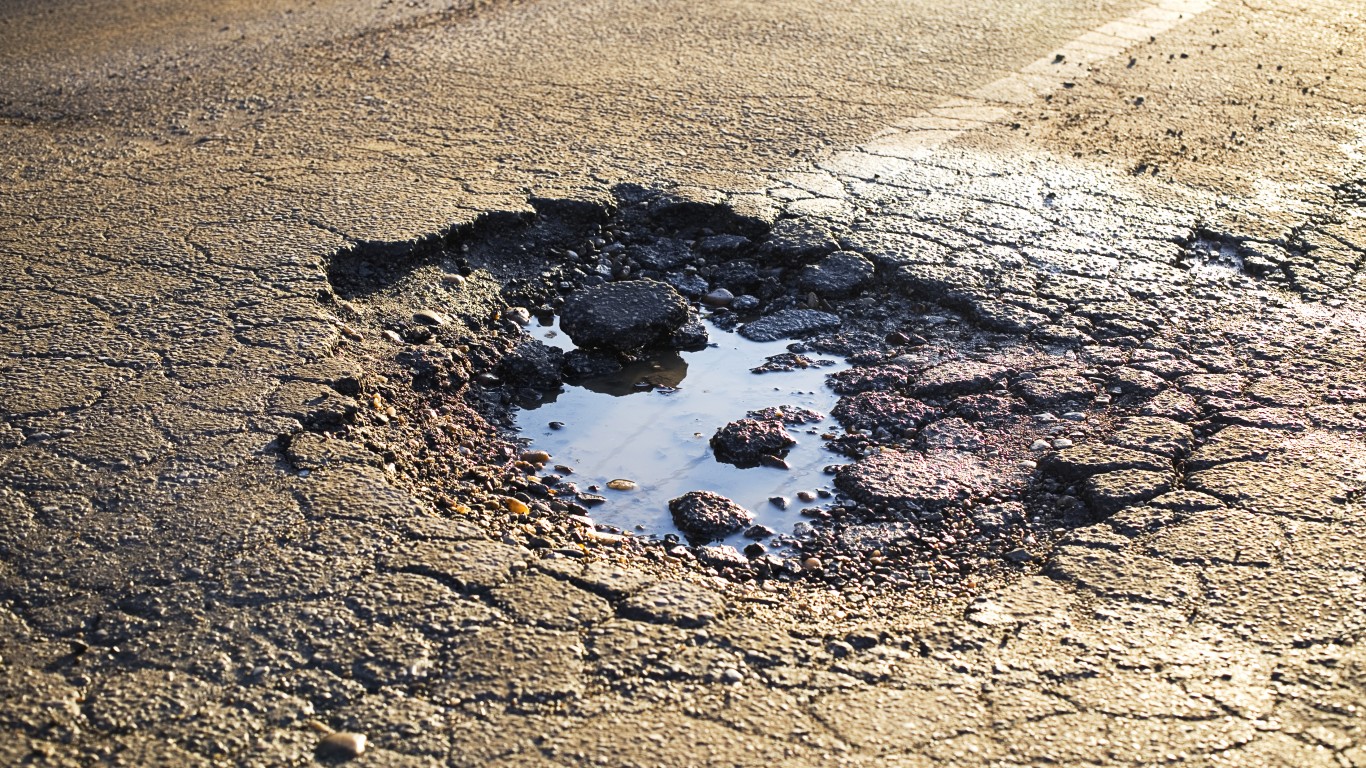
The Reason Foundation report found that nationwide, the condition of highway bridges improved slightly in 2021 from 2020. Of the 617,008 highway bridges considered, 7.02% were rated structurally deficient for 2021. (Also see: This State Has the Worst Highways in America.)
While the best states — Arizona, Nevada, Texas, and Delaware — reported less than 2% of their bridges as structurally deficient, West Virginia reported a whopping 20.37% of its bridges as structurally deficient. Close behind were Iowa, Rhode Island, and South Dakota with over 17% of their bridges structurally deficient. In all, nine states reported over 10% of bridges structurally deficient. On the plus side, 39 states reported at least some improvement in the percentage of structurally deficient bridges between 2020 and 2021.
It is important to note that the measure capital and bridge disbursements — or the costs to build new, and widen existing, highways and bridges — is ranked by the adjusted ratio, which is the disbursement per lane-mile divided by the expected disbursement per lane-mile.
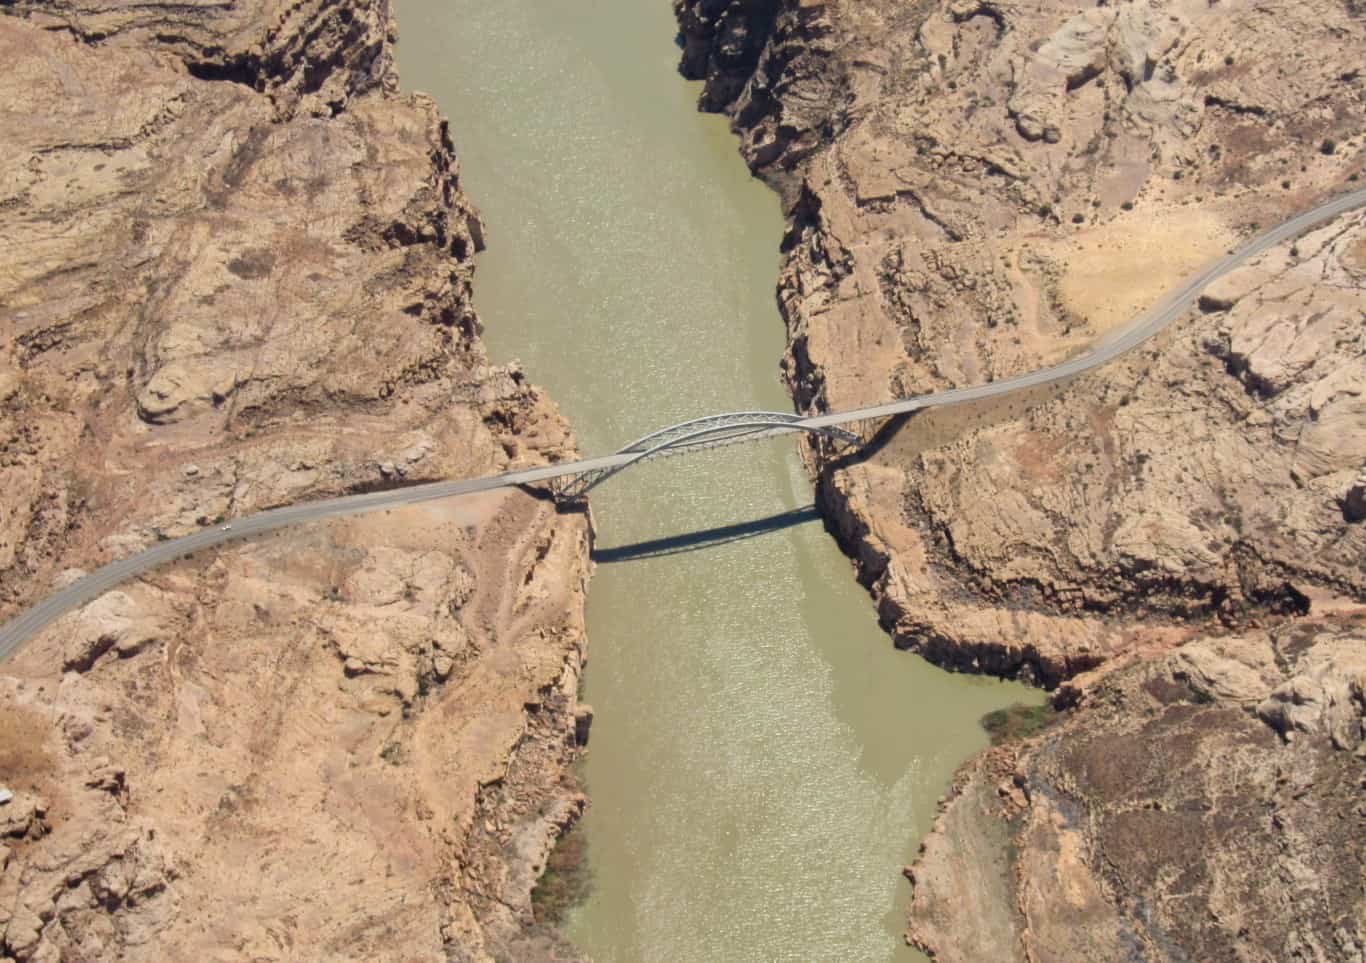
50. Arizona

- Percent structurally deficient bridges, 2021: 1.38%
- Capital and bridge disbursements, 2020: $68,623 per lane-mile
- Expected capital and bridge disbursements, 2020: $44,429 per lane-mile
- Adjusted ratio: 1.54 — 5th lowest
- State’s highway system overall rank: 30
- State-control highway miles: 20,046 — 20th lowest
- Famous bridge in Arizona: Glen Canyon Dam Bridge
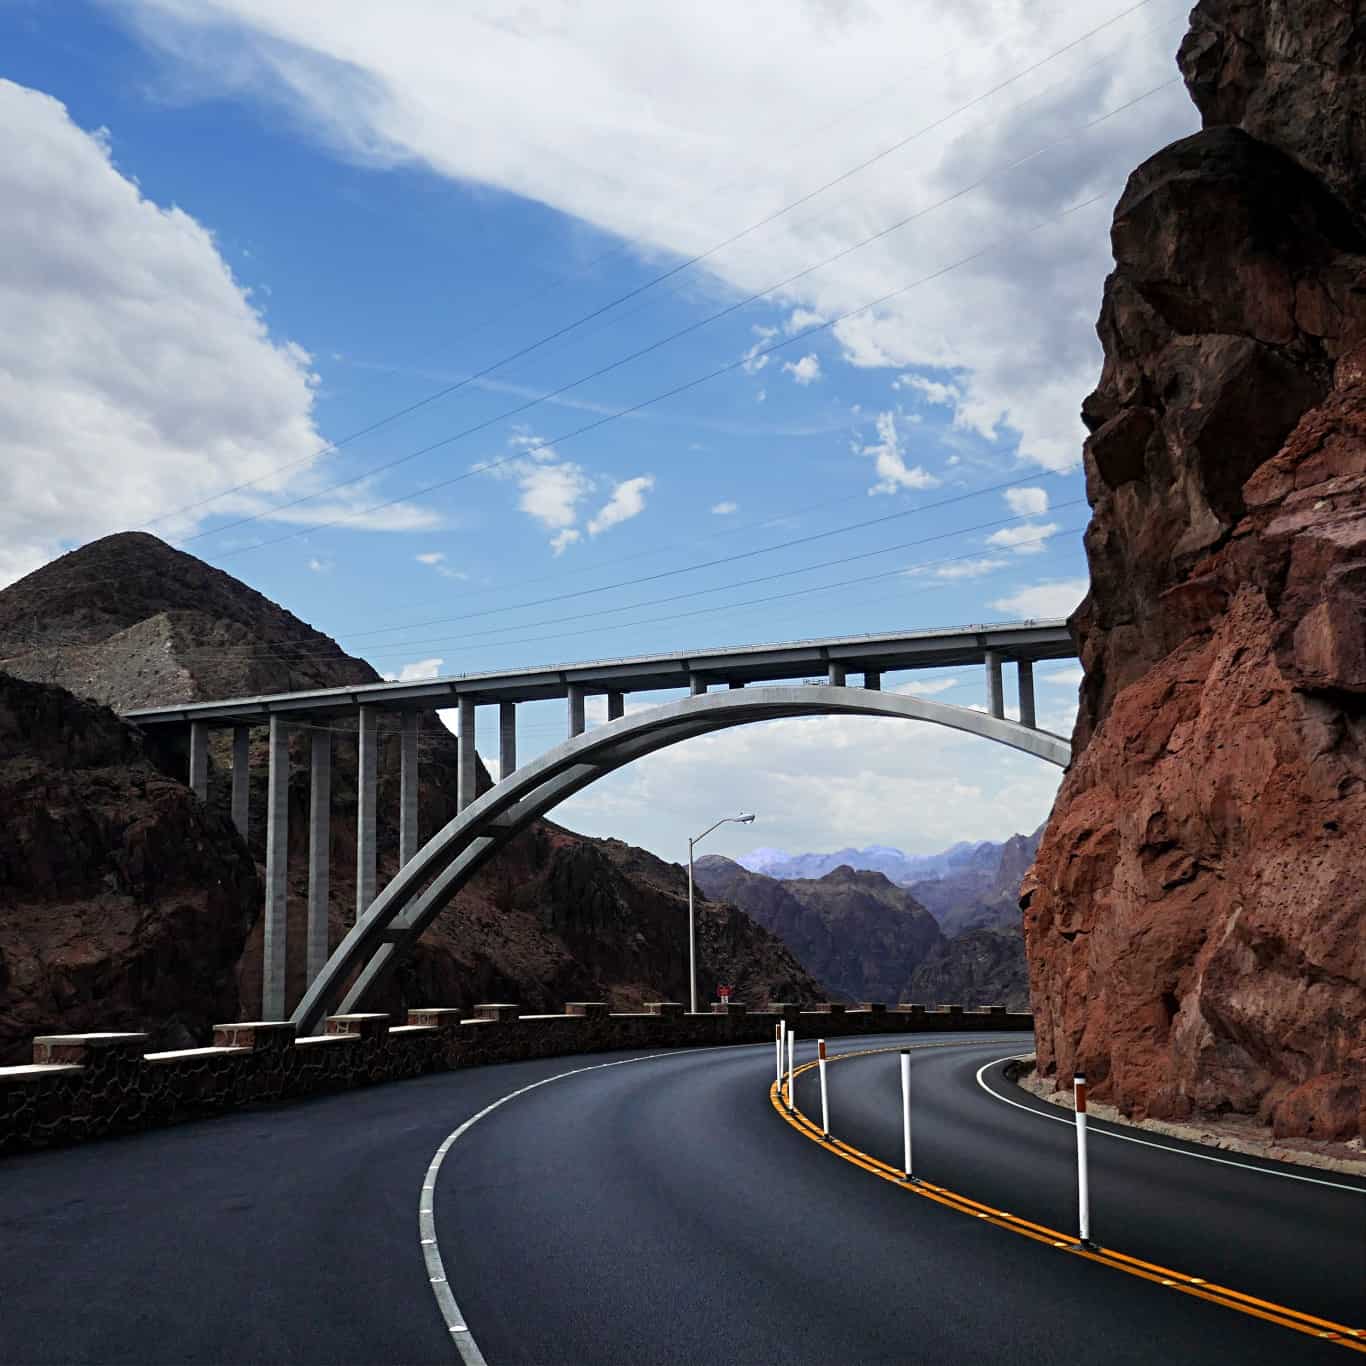
49. Nevada
- Percent structurally deficient bridges, 2021: 1.40%
- Capital and bridge disbursements, 2020: $51,121 per lane-mile
- Expected capital and bridge disbursements, 2020: $37,692 per lane-mile
- Adjusted ratio: 1.36 — 7th lowest
- State’s highway system overall rank: 21
- State-control highway miles: 13,509 — 11th lowest
- Famous bridge in Nevada: Mike O’Callaghan-Pat Tillman Memorial Bridge
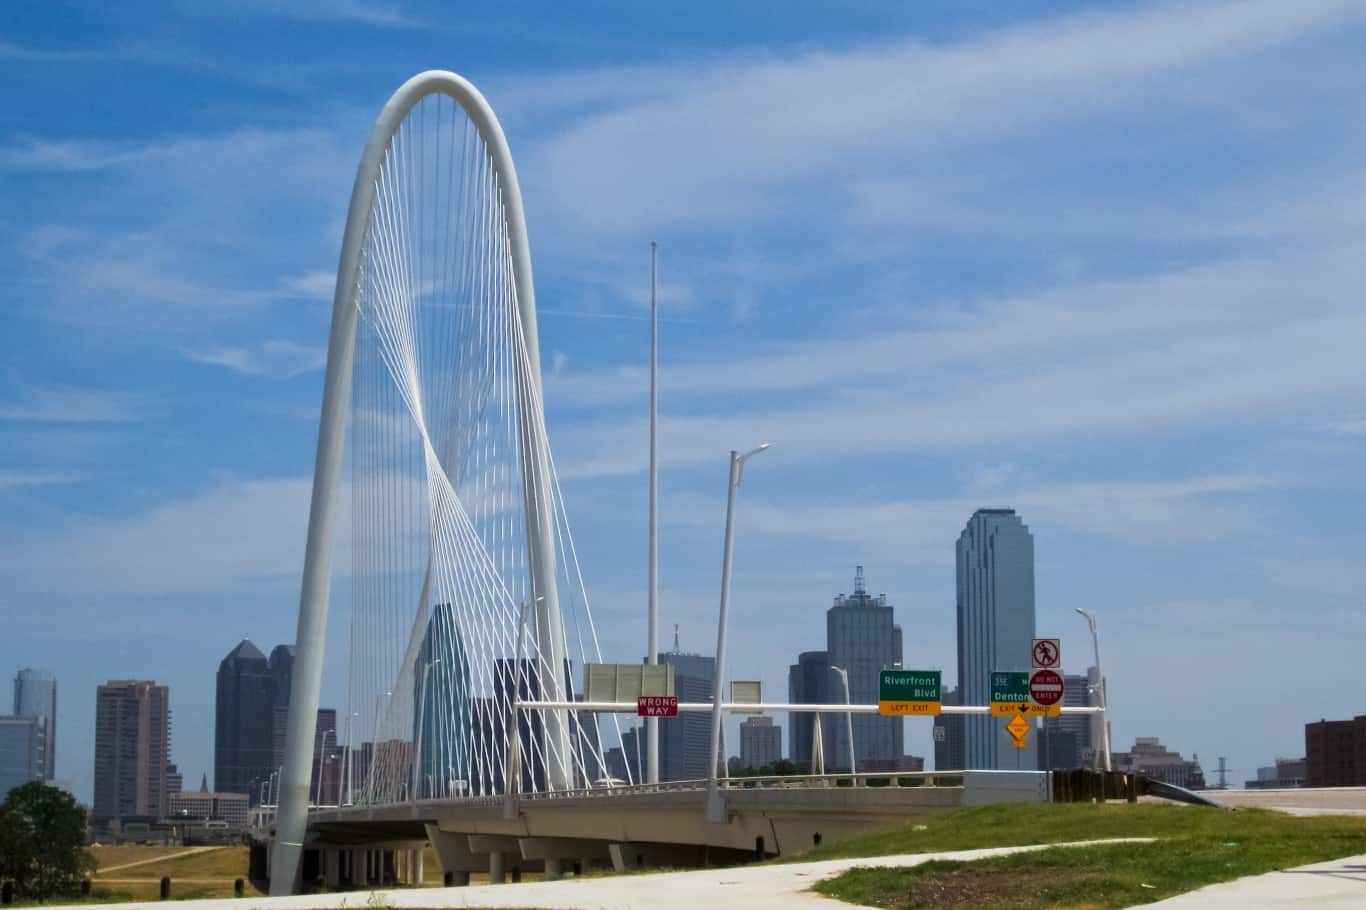
48. Texas
- Percent structurally deficient bridges, 2021: 1.43%
- Capital and bridge disbursements, 2020: $48,485 per lane-mile
- Expected capital and bridge disbursements, 2020: $44,236 per lane-mile
- Adjusted ratio: 1.10 — 20th lowest
- State’s highway system overall rank: 19
- State-control highway miles: 198,465 — the highest
- Famous bridge in Texas: Margaret Hunt Hill Bridge
47. Delaware
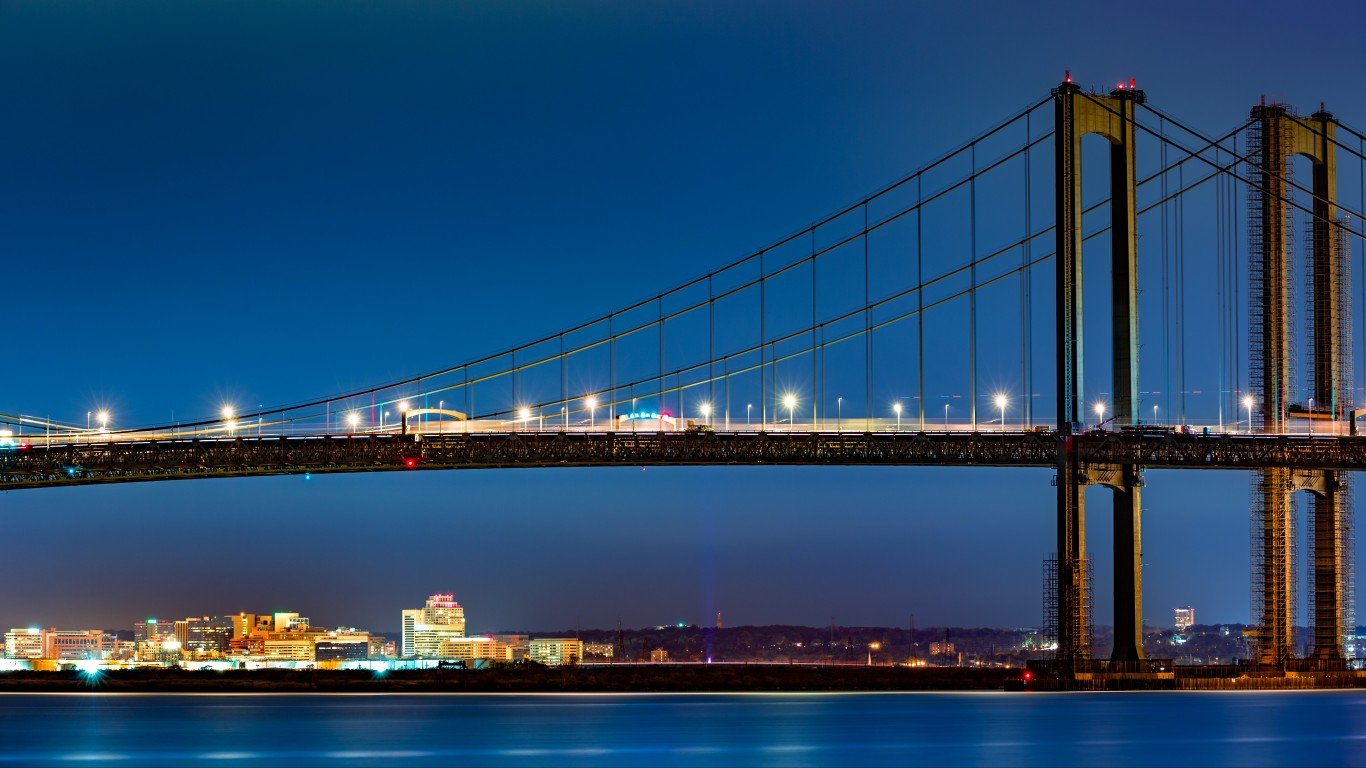
- Percent structurally deficient bridges, 2021: 1.94%
- Capital and bridge disbursements, 2020: $49,325 per lane-mile
- Expected capital and bridge disbursements, 2020: $82,074 per lane-mile
- Adjusted ratio: 0.60 — 10th highest
- State’s highway system overall rank: 35
- State-control highway miles: 11,998 — 9th lowest
- Famous bridge in Delaware: Delaware Memorial Bridge
46. Utah
- Percent structurally deficient bridges, 2021: 2.06%
- Capital and bridge disbursements, 2020: $58,599 per lane-mile
- Expected capital and bridge disbursements, 2020: $45,052 per lane-mile
- Adjusted ratio: 1.30 — 11th lowest
- State’s highway system overall rank: 10
- State-control highway miles: 16,023 — 14th lowest
- Famous bridge in Utah: Hite Crossing Bridge
45. Georgia
- Percent structurally deficient bridges, 2021: 2.13%
- Capital and bridge disbursements, 2020: $31,611 per lane-mile
- Expected capital and bridge disbursements, 2020: $56,314 per lane-mile
- Adjusted ratio: 0.56 — 8th highest
- State’s highway system overall rank: 4
- State-control highway miles: 49,497 — 11th highest
- Famous bridge in Georgia: Tallulah Gorge Bridge
44. Vermont
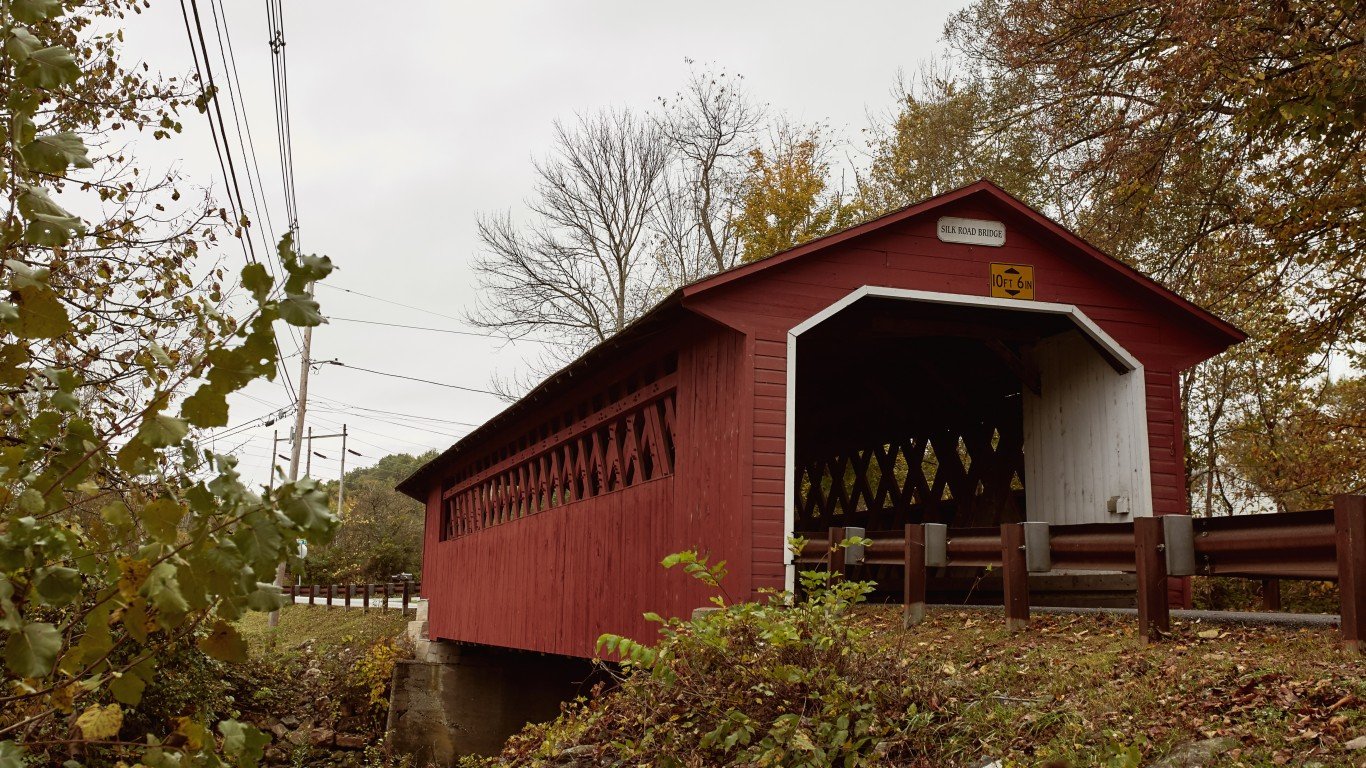
- Percent structurally deficient bridges, 2021: 2.40%
- Capital and bridge disbursements, 2020: $32,497 per lane-mile
- Expected capital and bridge disbursements, 2020: $26,905 per lane-mile
- Adjusted ratio: 1.21 — 16th lowest
- State’s highway system overall rank: 38
- State-control highway miles: 5,998 — 3rd lowest
- Famous bridge in Vermont: Silk Covered Bridge
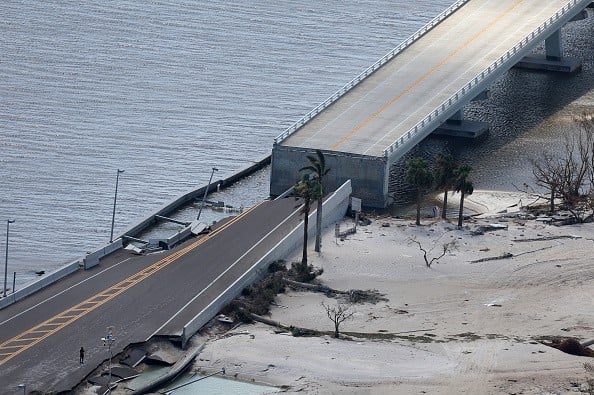
43. Florida
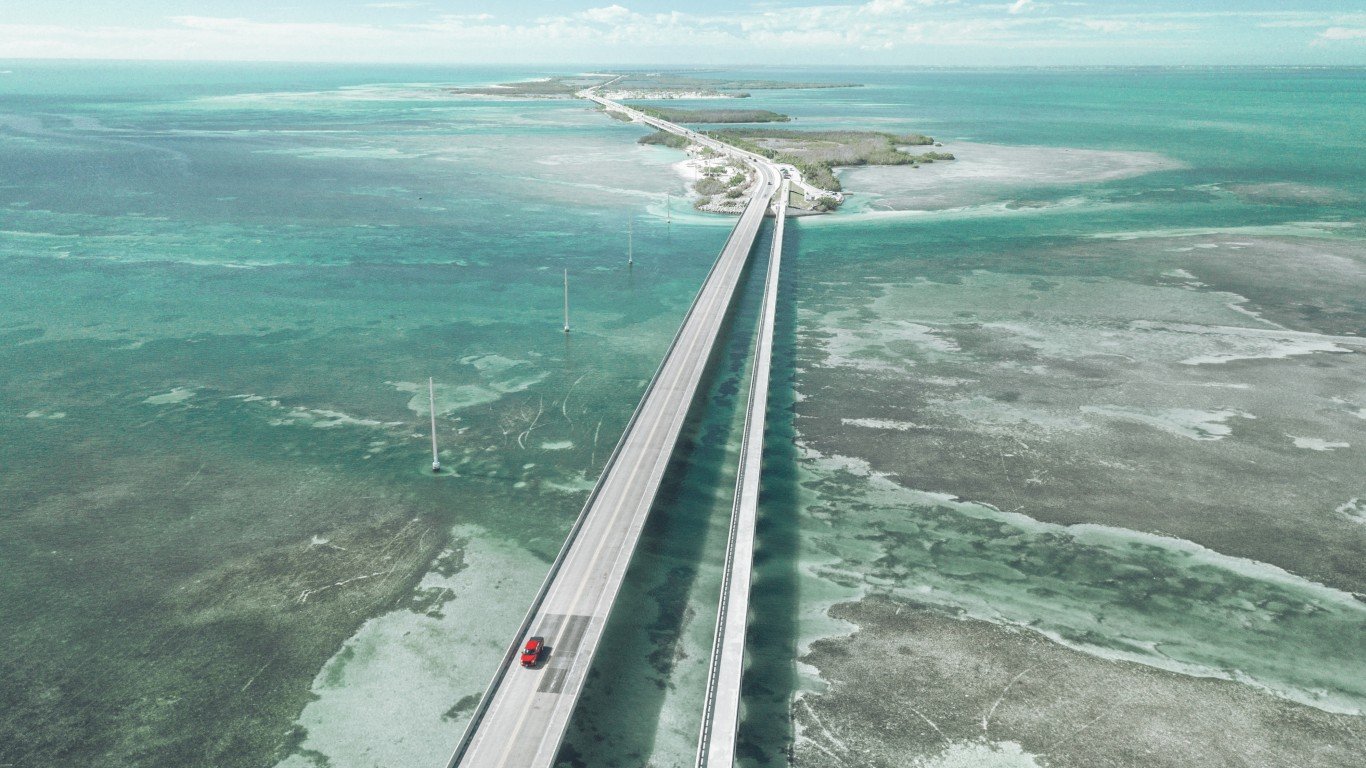
- Percent structurally deficient bridges, 2021: 3.62%
- Capital and bridge disbursements, 2020: $144,620 per lane-mile
- Expected capital and bridge disbursements, 2020: $108,485 per lane-mile
- Adjusted ratio: 1.33 — 8th lowest
- State’s highway system overall rank: 8
- State-control highway miles: 45,013 — 12th highest
- Famous bridge in Florida: Seven Mile Bridge
42. Alabama
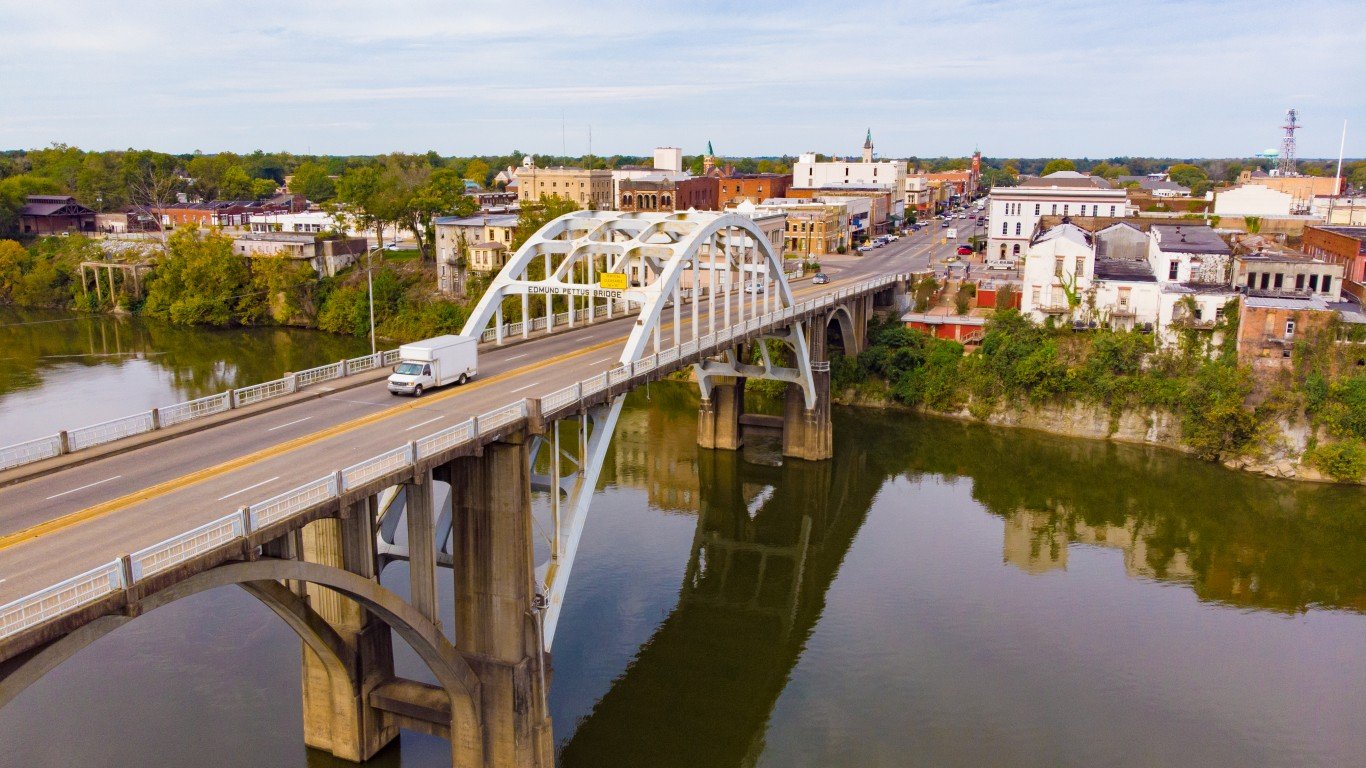
- Percent structurally deficient bridges, 2021: 3.63%
- Capital and bridge disbursements, 2020: $46,715 per lane-mile
- Expected capital and bridge disbursements, 2020: $45,858 per lane-mile
- Adjusted ratio: 1.02 — 24th lowest
- State’s highway system overall rank: 15
- State-control highway miles: 29,707 — 20th highest
- Famous bridge in Alabama: Edmund Pettus Bridge
41. Virginia
- Percent structurally deficient bridges, 2021: 3.79%
- Capital and bridge disbursements, 2020: $11,862 per lane-mile
- Expected capital and bridge disbursements, 2020: $42,748 per lane-mile
- Adjusted ratio: 0.28 — the highest
- State’s highway system overall rank: 1
- State-control highway miles: 128,989 — 3rd highest
- Famous bridge in Virginia: Chesapeake Bay Bridge-Tunnel
40. Tennessee
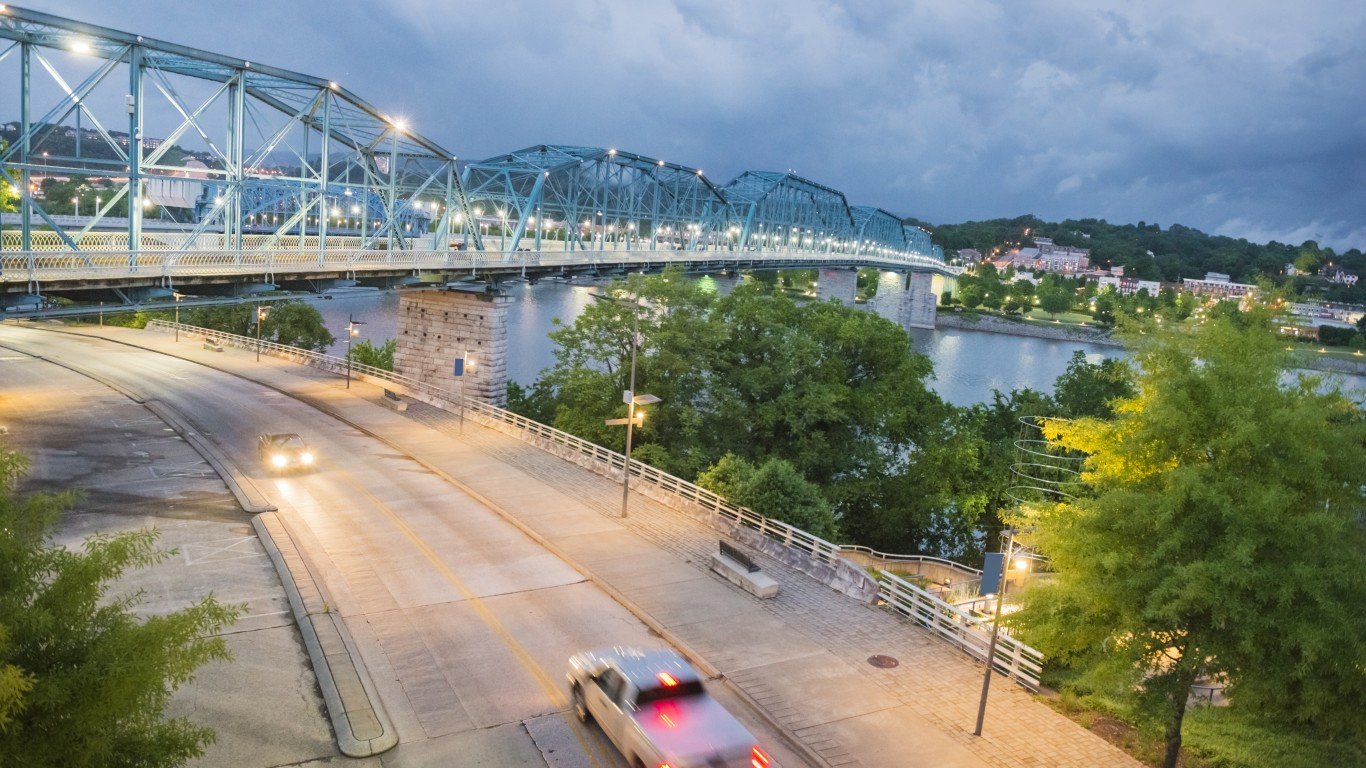
- Percent structurally deficient bridges, 2021: 4.14%
- Capital and bridge disbursements, 2020: $31,058 per lane-mile
- Expected capital and bridge disbursements, 2020: $52,898 per lane-mile
- Adjusted ratio: 0.59 — 9th highest
- State’s highway system overall rank: 3
- State-control highway miles: 37,746 — 17th highest
- Famous bridge in Tennessee: Walnut Street Bridge
39. Minnesota

- Percent structurally deficient bridges, 2021: 4.58%
- Capital and bridge disbursements, 2020: $41,049 per lane-mile
- Expected capital and bridge disbursements, 2020: $36,827 per lane-mile
- Adjusted ratio: 1.11 — 18th lowest
- State’s highway system overall rank: 12
- State-control highway miles: 29,176 — 22nd highest
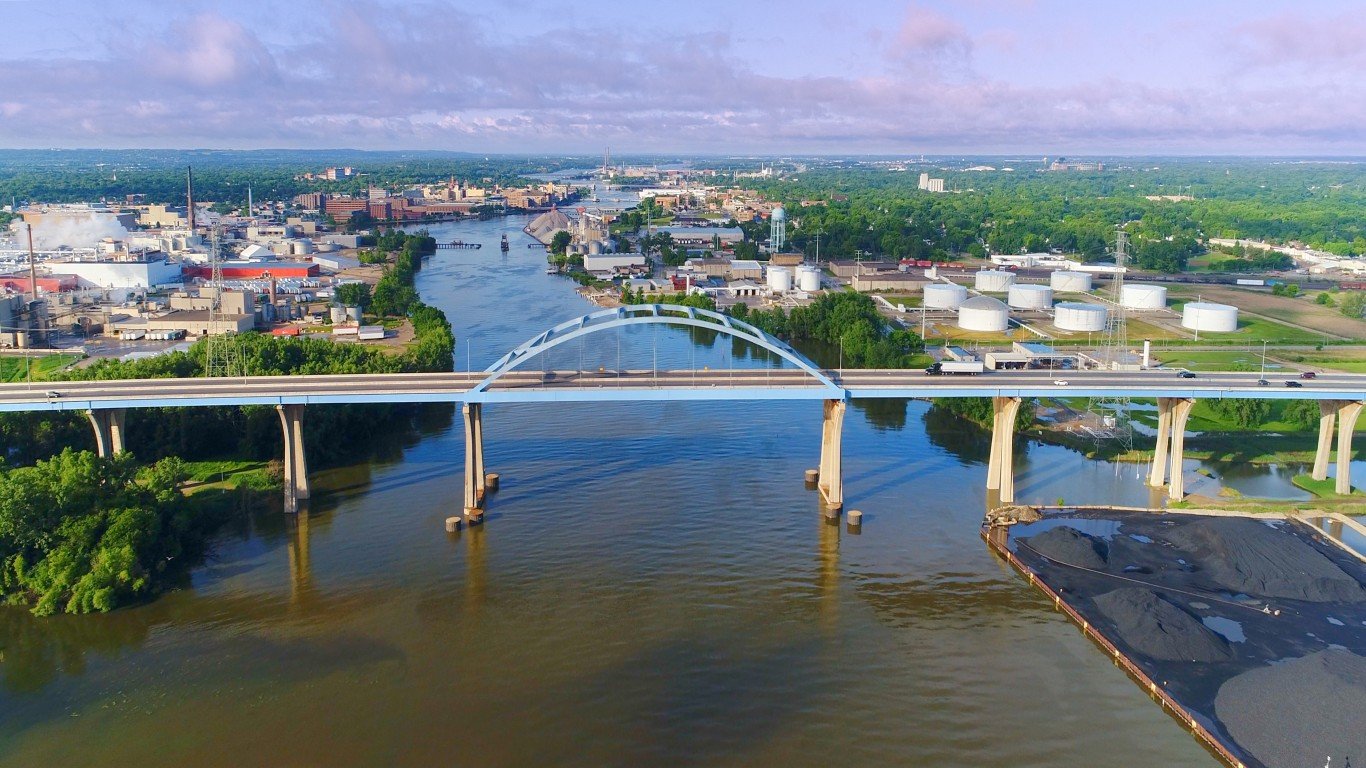
- Famous bridge in Minnesota: Lowry Avenue Bridge
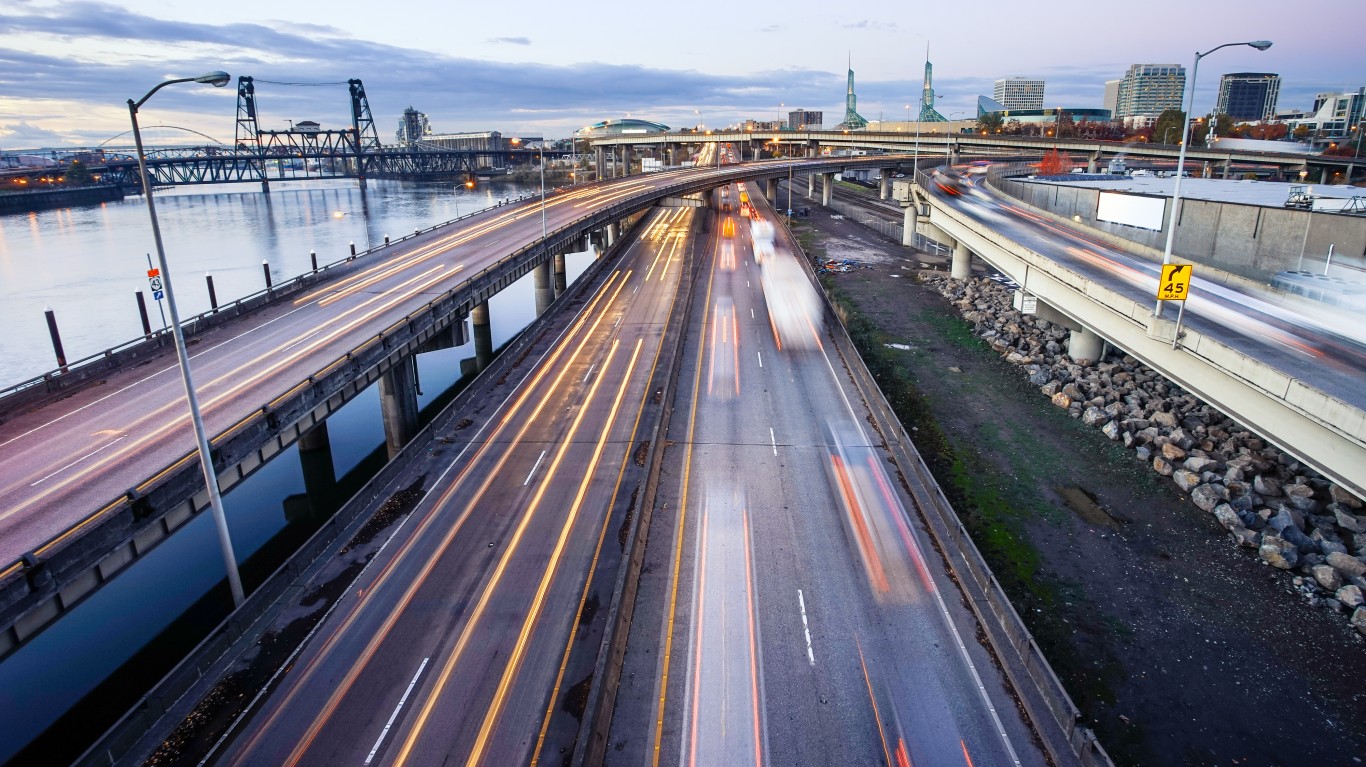
38. Oregon
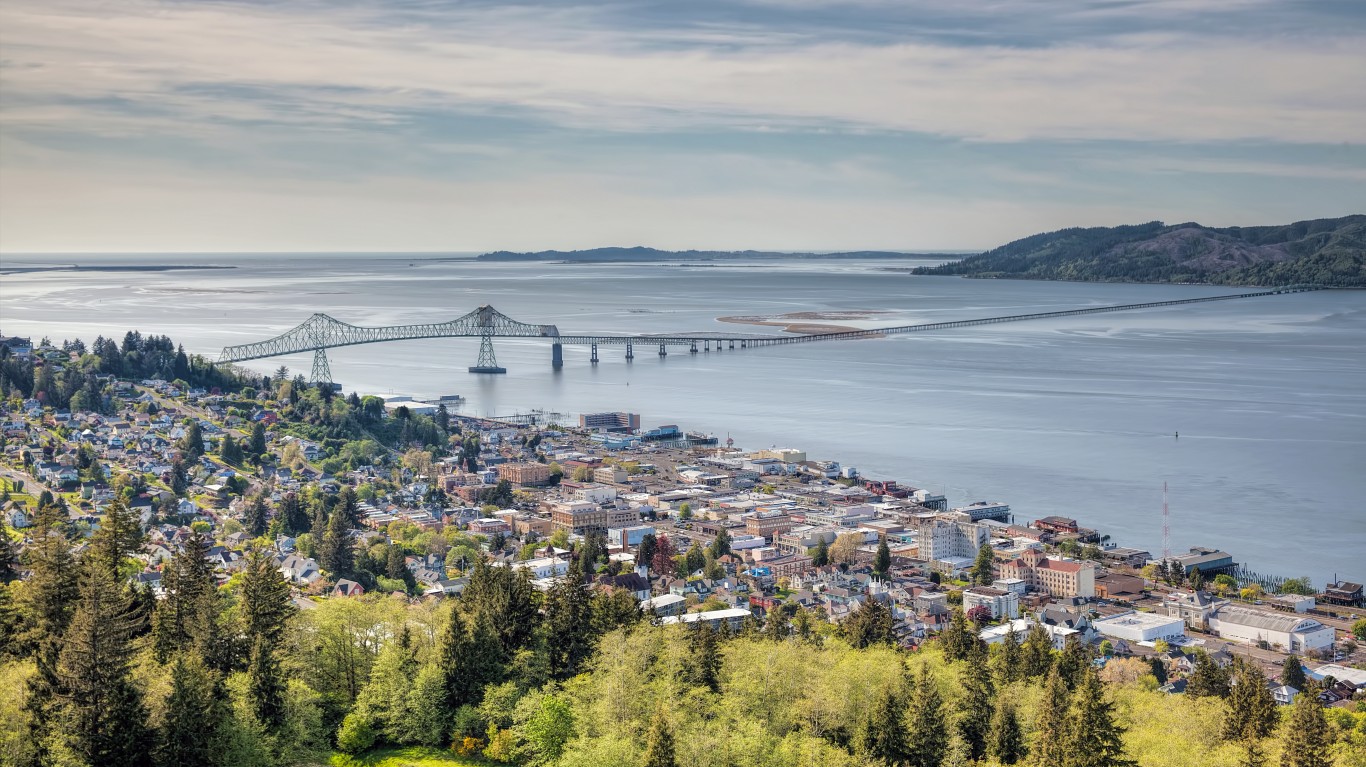
- Percent structurally deficient bridges, 2021: 4.64%
- Capital and bridge disbursements, 2020: $50,073 per lane-mile
- Expected capital and bridge disbursements, 2020: $38,506 per lane-mile
- Adjusted ratio: 1.30 — 12th lowest
- State’s highway system overall rank: 37
- State-control highway miles: 18,460 — 18th lowest
- Famous bridge in Oregon: Astoria-Megler Bridge
37. Maryland
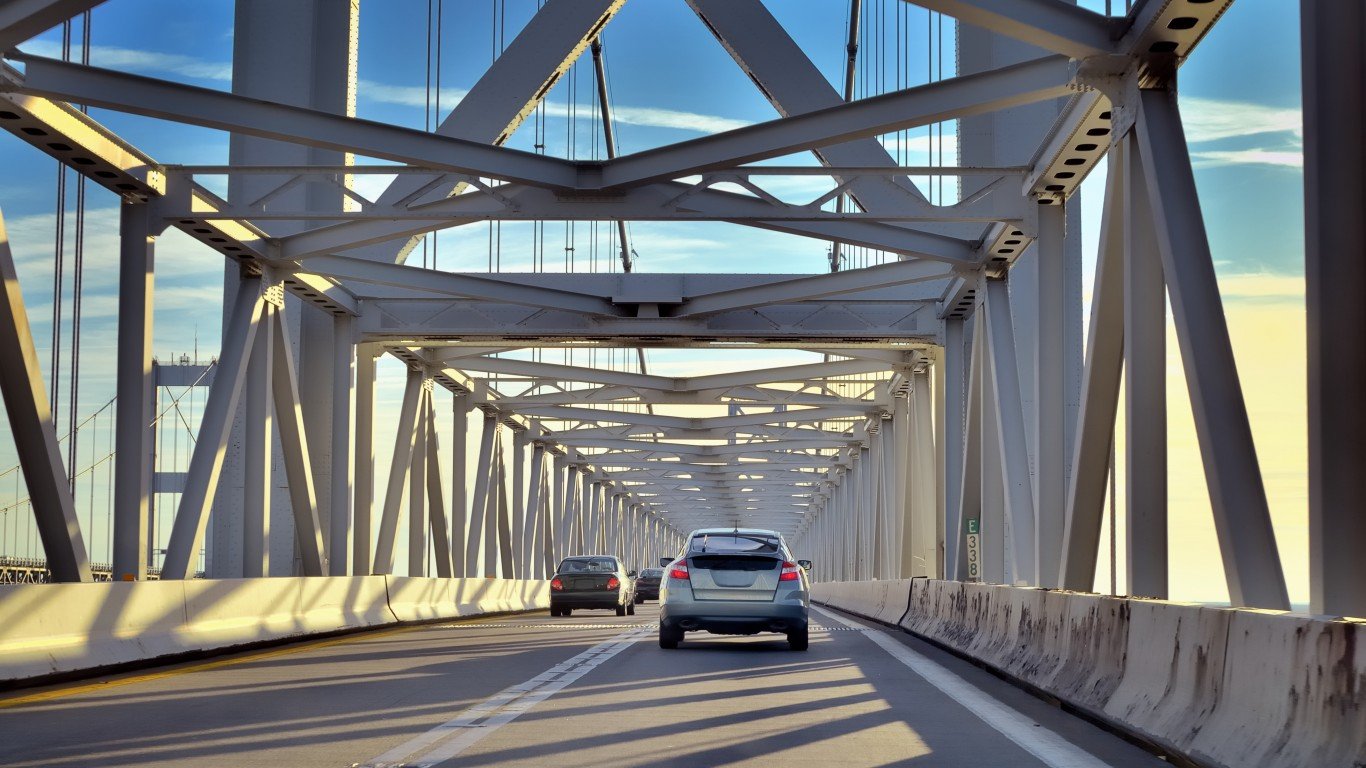
- Percent structurally deficient bridges, 2021: 4.65%
- Capital and bridge disbursements, 2020: $101,839 per lane-mile
- Expected capital and bridge disbursements, 2020: $94,042 per lane-mile
- Adjusted ratio: 1.08 — 21st lowest
- State’s highway system overall rank: 24
- State-control highway miles: 14,928 — 12th lowest
- Famous bridge in Maryland: Chesapeake Bay Bridge
36. Washington

- Percent structurally deficient bridges, 2021: 4.80%
- Capital and bridge disbursements, 2020: $97,951 per lane-mile
- Expected capital and bridge disbursements, 2020: $46,867 per lane-mile
- Adjusted ratio: 2.09 — the lowest
- State’s highway system overall rank: 46
- State-control highway miles: 18,450 — 19th lowest
- Famous bridge in Washington: Fred G. Redmon Memorial Bridge
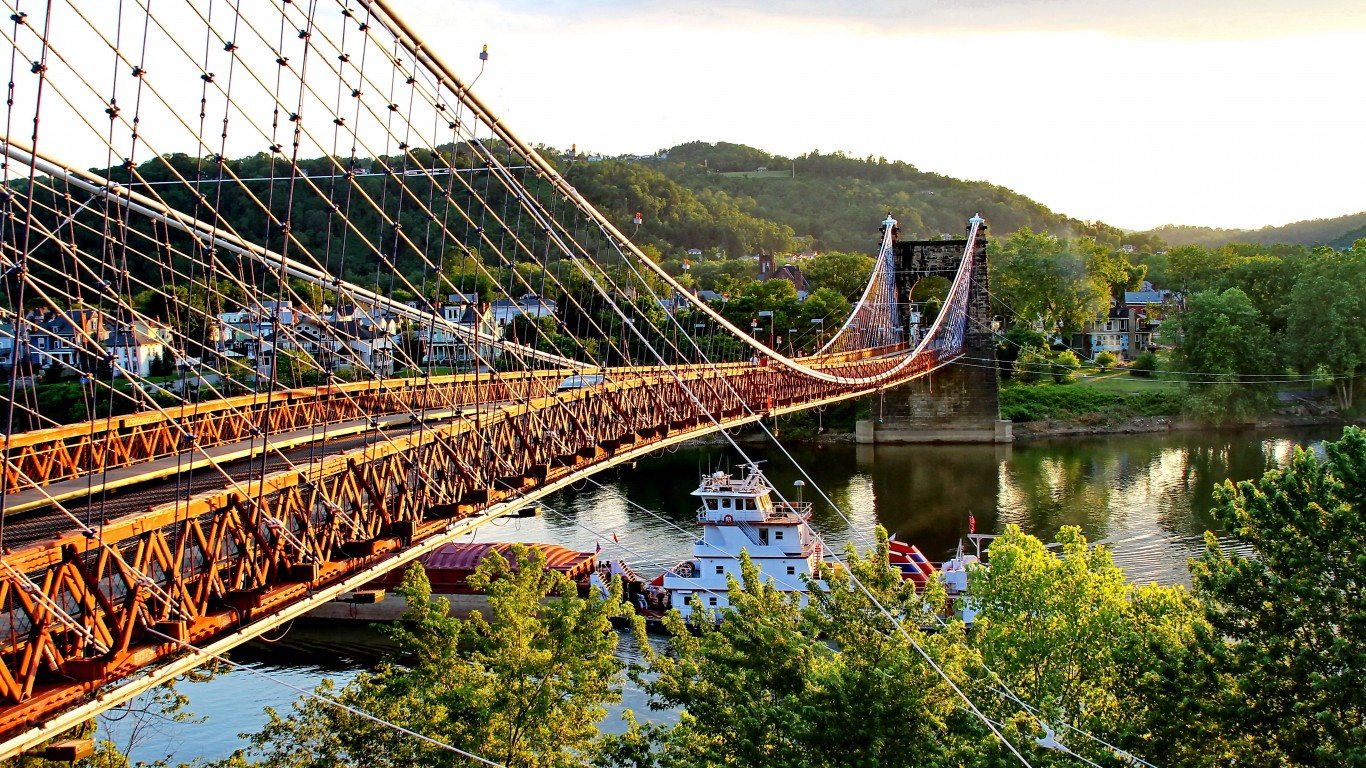
35. Ohio
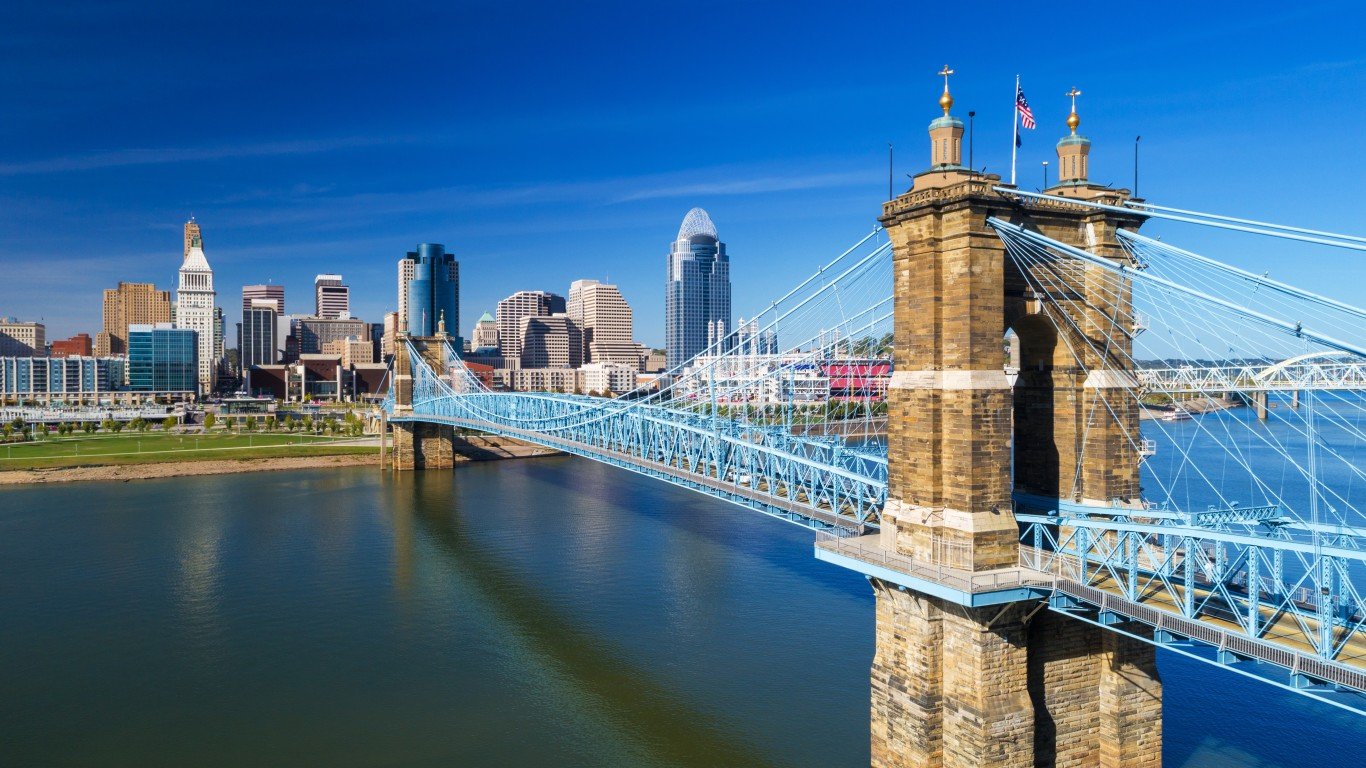
- Percent structurally deficient bridges, 2021: 4.91%
- Capital and bridge disbursements, 2020: $39,661 per lane-mile
- Expected capital and bridge disbursements, 2020: $56,700 per lane-mile
- Adjusted ratio: 0.70 — 16th highest
- State’s highway system overall rank: 17
- State-control highway miles: 49,681 — 10th highest
- Famous bridge in Ohio: Roebling Suspension Bridge
34. Kansas
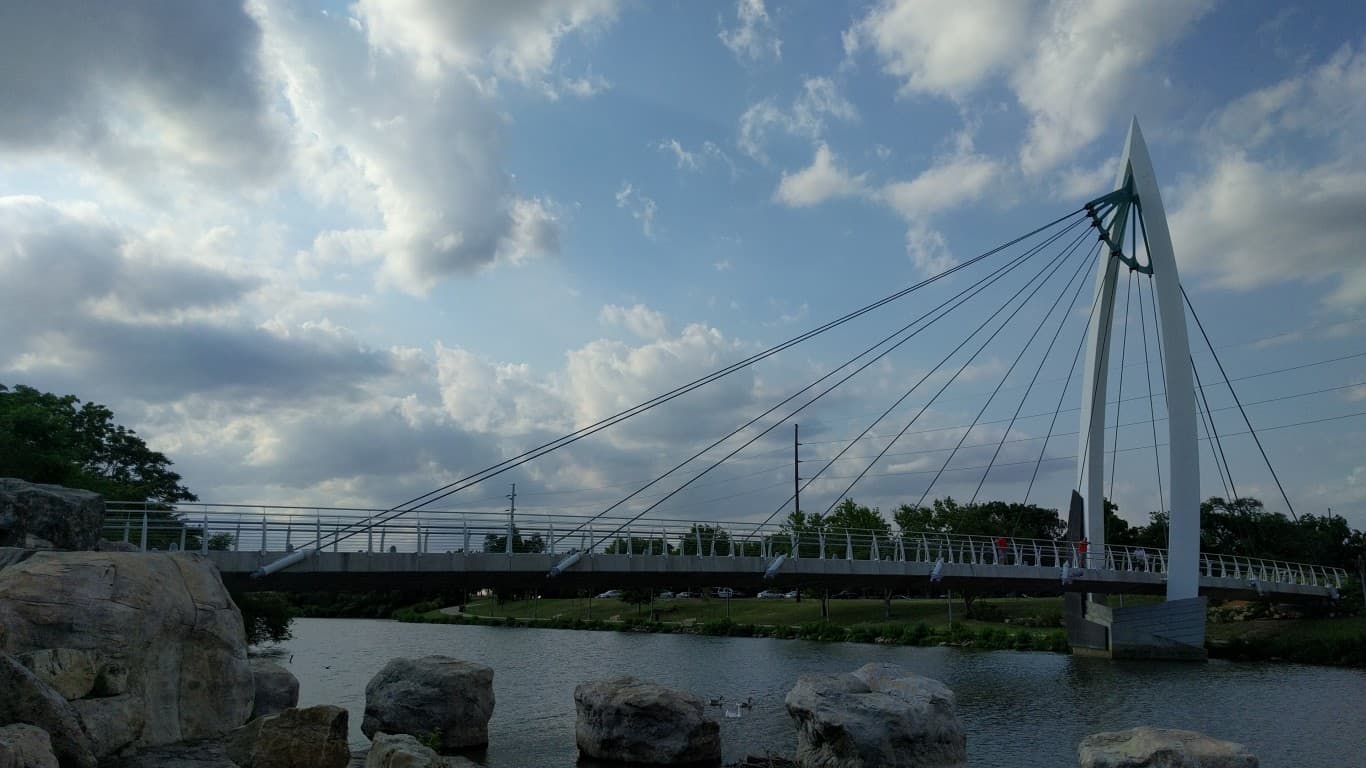
- Percent structurally deficient bridges, 2021: 5.12%
- Capital and bridge disbursements, 2020: $18,545 per lane-mile
- Expected capital and bridge disbursements, 2020: $27,958 per lane-mile
- Adjusted ratio: 0.66 — 13th highest
- State’s highway system overall rank: 22
- State-control highway miles: 24,037 — 24th lowest
- Famous bridge in Kansas: Keeper of the Plains Bridge
33. New Mexico
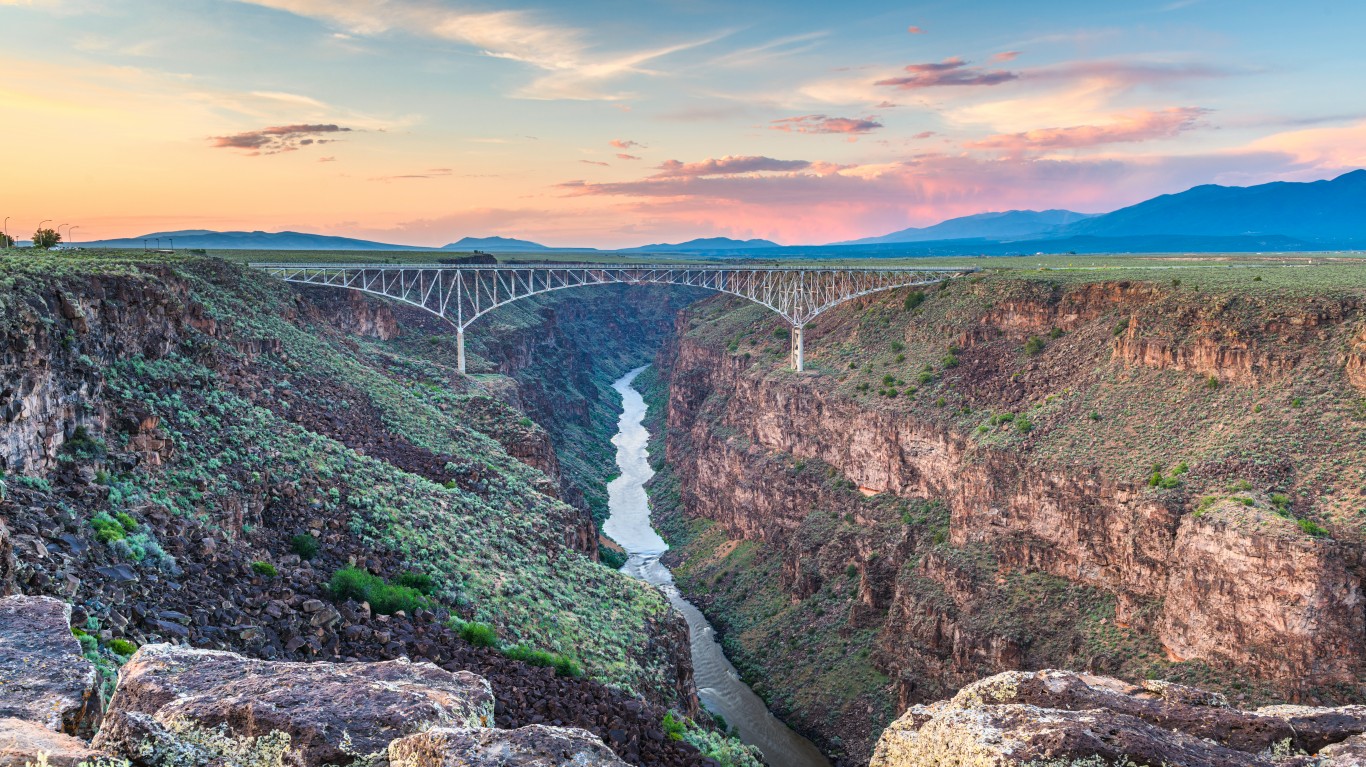
- Percent structurally deficient bridges, 2021: 5.17%
- Capital and bridge disbursements, 2020: $14,794 per lane-mile
- Expected capital and bridge disbursements, 2020: $26,872 per lane-mile
- Adjusted ratio: 0.55 — 7th highest
- State’s highway system overall rank: 36
- State-control highway miles: 29,430 — 21st highest
- Famous bridge in New Mexico: Rio Grande Gorge Bridge
32. Idaho

- Percent structurally deficient bridges, 2021: 5.22%
- Capital and bridge disbursements, 2020: $49,130 per lane-mile
- Expected capital and bridge disbursements, 2020: $26,779 per lane-mile
- Adjusted ratio: 1.83 — 3rd lowest
- State’s highway system overall rank:34
- State-control highway miles: 12,272 — 10th lowest
- Famous bridge in Idaho: Perrine Bridge
31. Arkansas
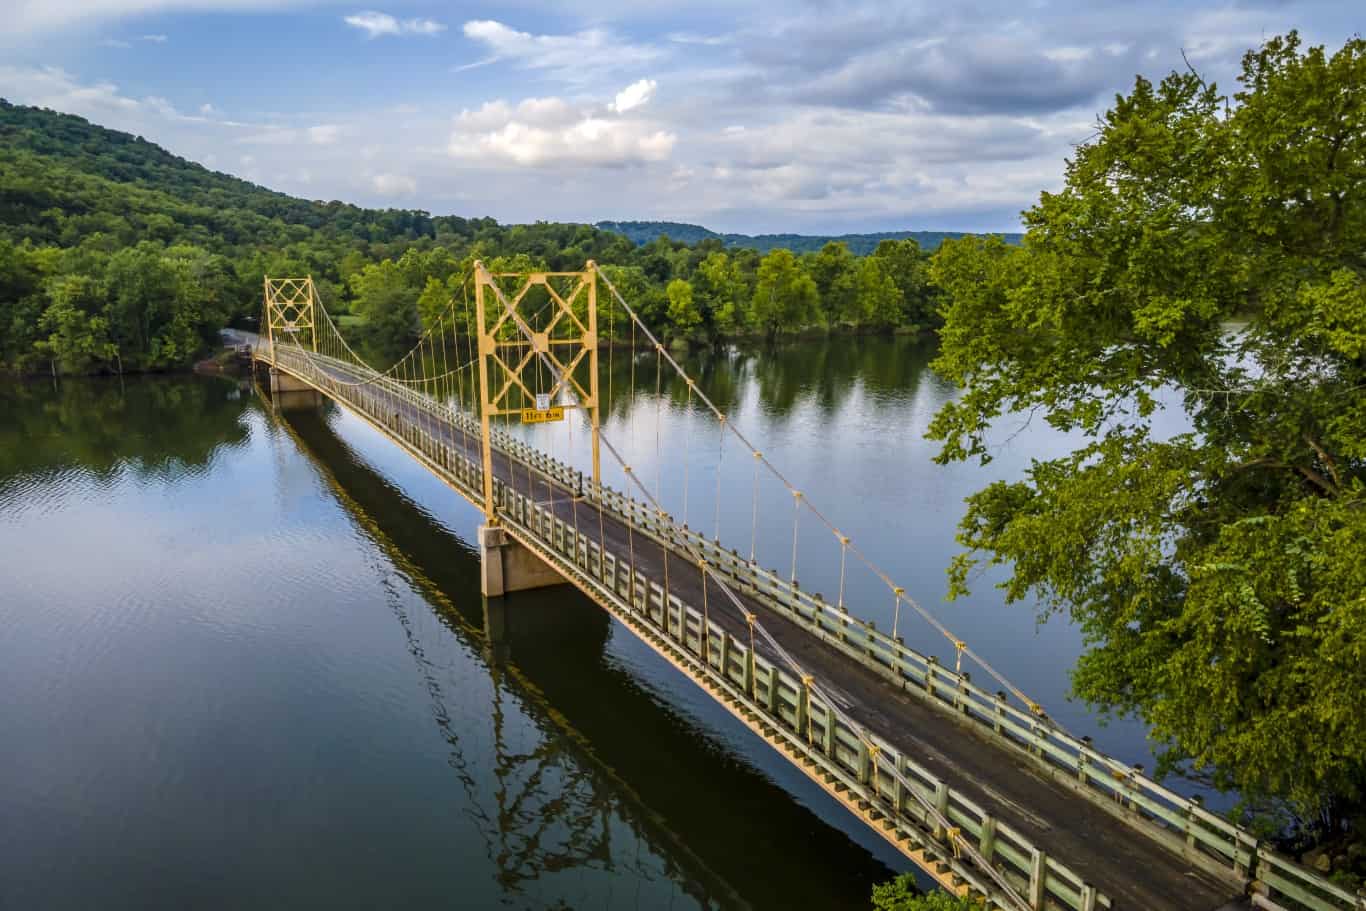
- Percent structurally deficient bridges, 2021: 5.25%
- Capital and bridge disbursements, 2020: $24,155 per lane-mile
- Expected capital and bridge disbursements, 2020: $35,260 per lane-mile
- Adjusted ratio: 0.69 — 15th highest
- State’s highway system overall rank: 13
- State-control highway miles: 38,078 — 16th highest
- Famous bridge in Arkansas: Beaver Bridge
30. Colorado
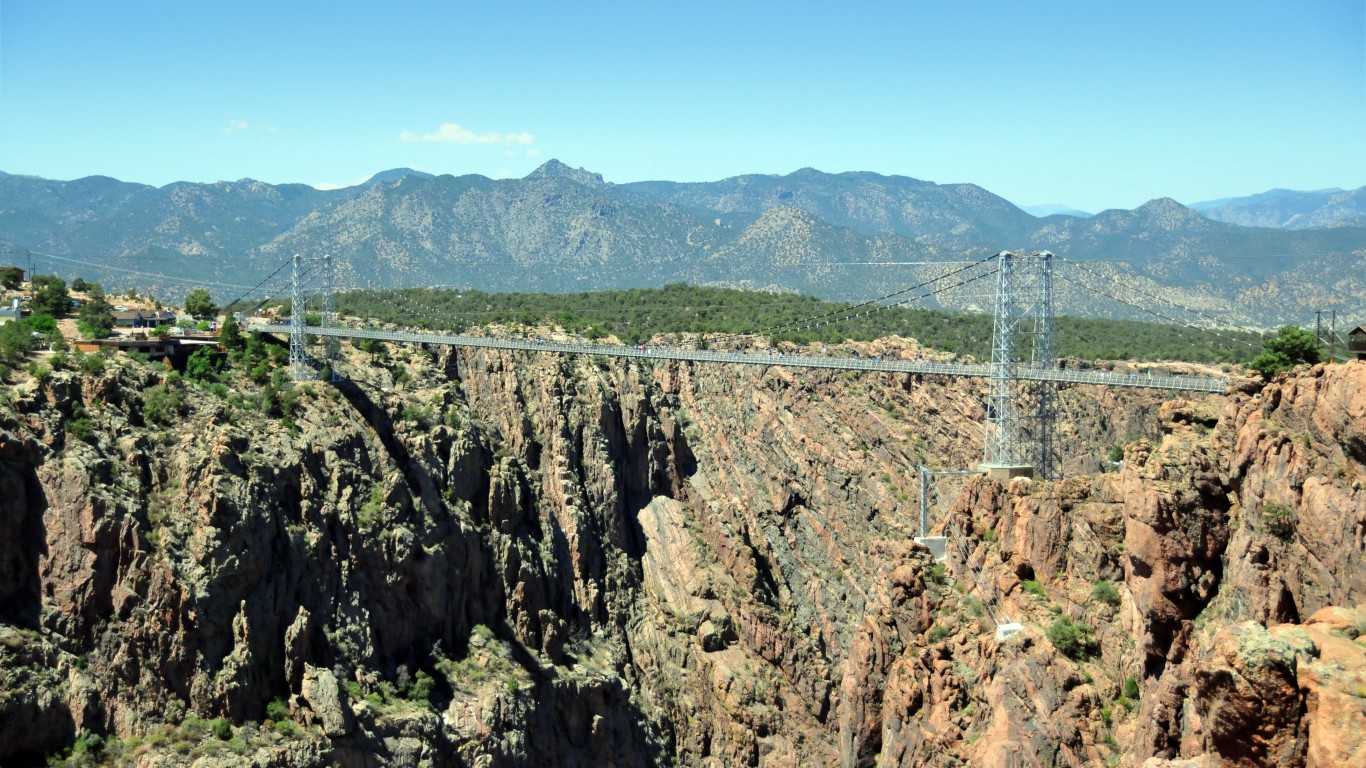
- Percent structurally deficient bridges, 2021: 5.29%
- Capital and bridge disbursements, 2020: $45,663 per lane-mile
- Expected capital and bridge disbursements, 2020: $43,457 per lane-mile
- Adjusted ratio: 1.05 — 23rd lowest
- State’s highway system overall rank: 43
- State-control highway miles: 23,022 — 23rd lowest
- Famous bridge in Colorado: Royal Gorge Bridge
29. Connecticut
- Percent structurally deficient bridges, 2021: 5.30%
- Capital and bridge disbursements, 2020: $94,435 per lane-mile
- Expected capital and bridge disbursements, 2020: $147,085 per lane-mile
- Adjusted ratio: 0.64 — 12th highest
- State’s highway system overall rank: 5
- State-control highway miles: 9,827 — 7th lowest
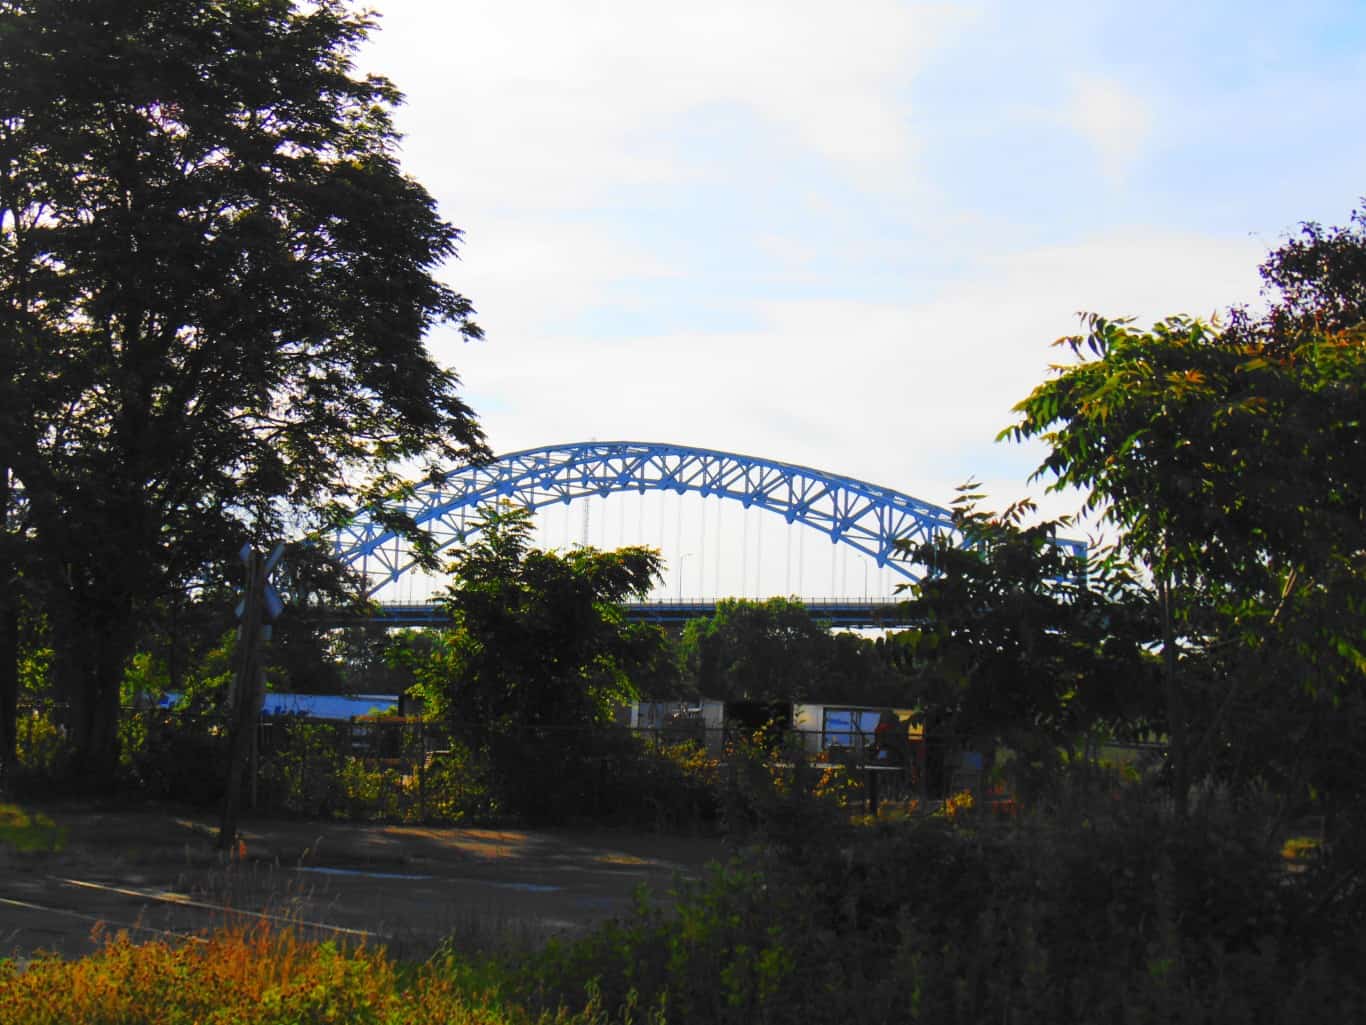
- Famous bridge in Connecticut: Arrigoni Bridge
28. South Carolina
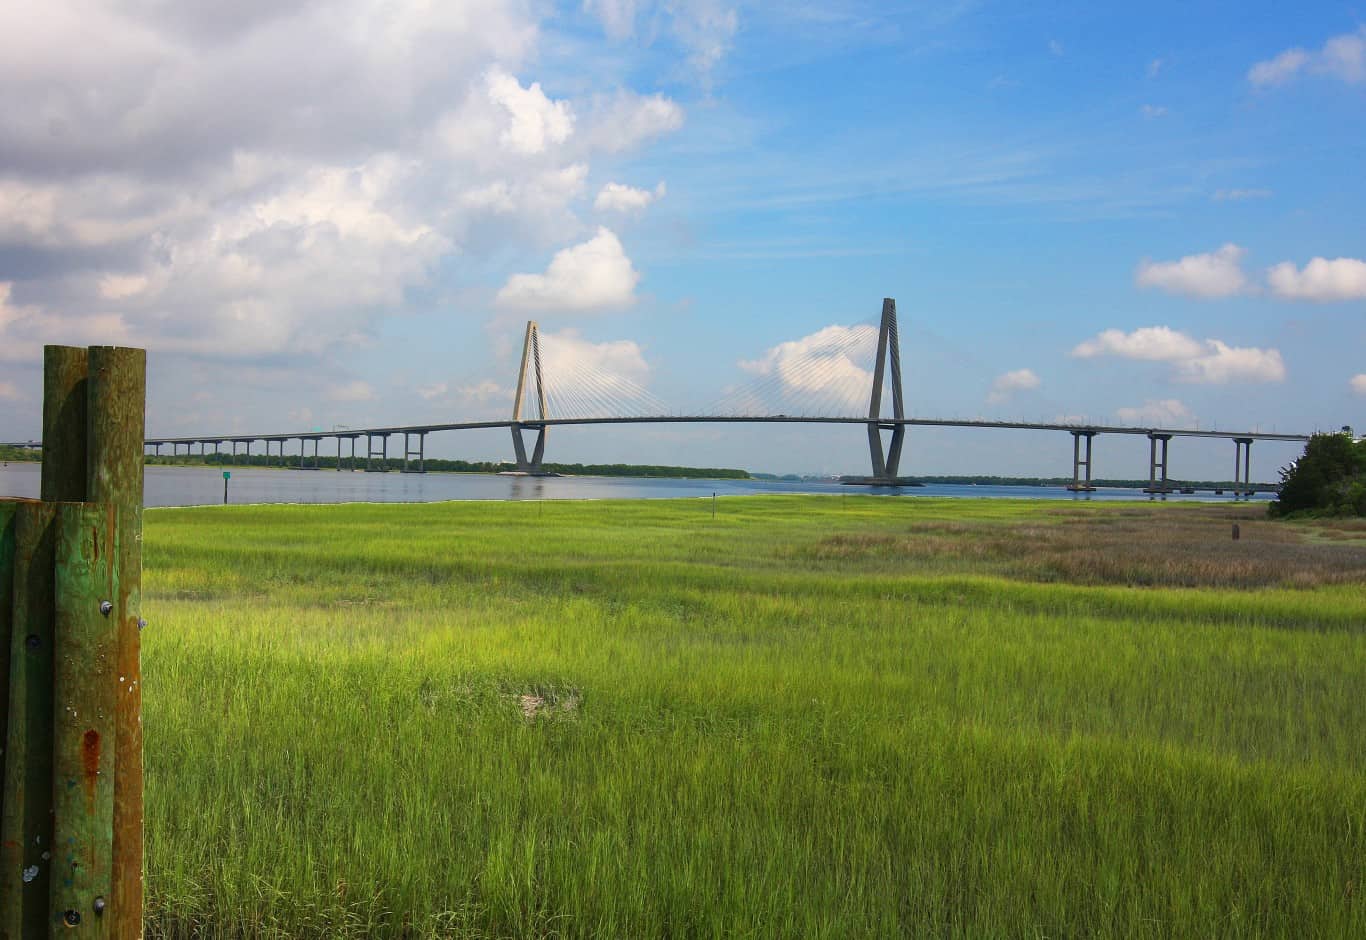
- Percent structurally deficient bridges, 2021: 5.31%
- Capital and bridge disbursements, 2020: $21,016 per lane-mile
- Expected capital and bridge disbursements, 2020: $45,109 per lane-mile
- Adjusted ratio: 0.47 — 5th highest
- State’s highway system overall rank: 6
- State-control highway miles: 90,552 — 4th highest
- Famous bridge in South Carolina: Arthur Ravenel Jr Bridge
27. Indiana
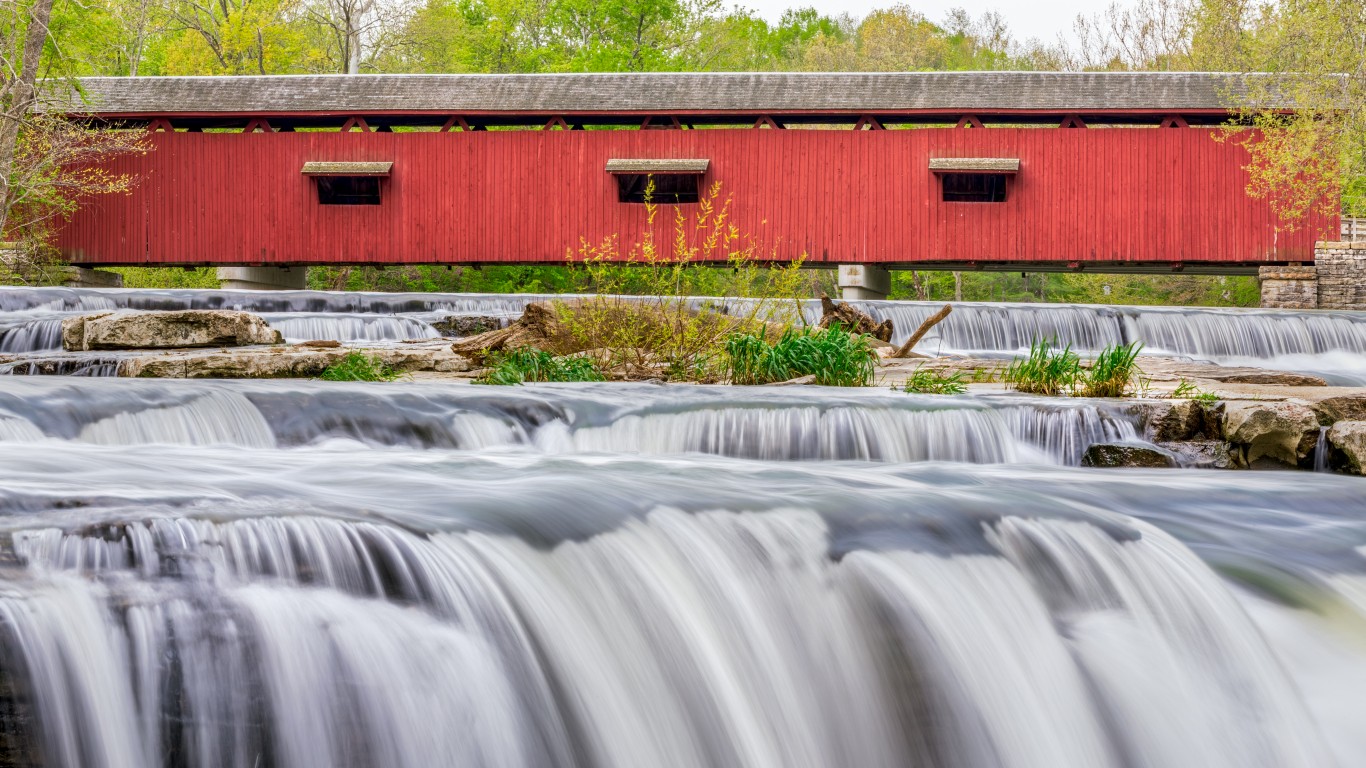
- Percent structurally deficient bridges, 2021: 5.60%
- Capital and bridge disbursements, 2020: $54,635 per lane-mile
- Expected capital and bridge disbursements, 2020: $44,368 per lane-mile
- Adjusted ratio: 1.23 — 14th lowest
- State’s highway system overall rank: 23
- State-control highway miles: 28,445 — 23rd highest
- Famous bridge in Indiana: Cataract Falls Covered Bridge
26. California

- Percent structurally deficient bridges, 2021: 5.80%
- Capital and bridge disbursements, 2020: $86,801 per lane-mile
- Expected capital and bridge disbursements, 2020: $71,250 per lane-mile
- Adjusted ratio: 1.22 — 15th lowest
- State’s highway system overall rank: 47
- State-control highway miles: 52,004 — 9th highest
- Famous bridge in California: Golden Gate Bridge
25. Kentucky
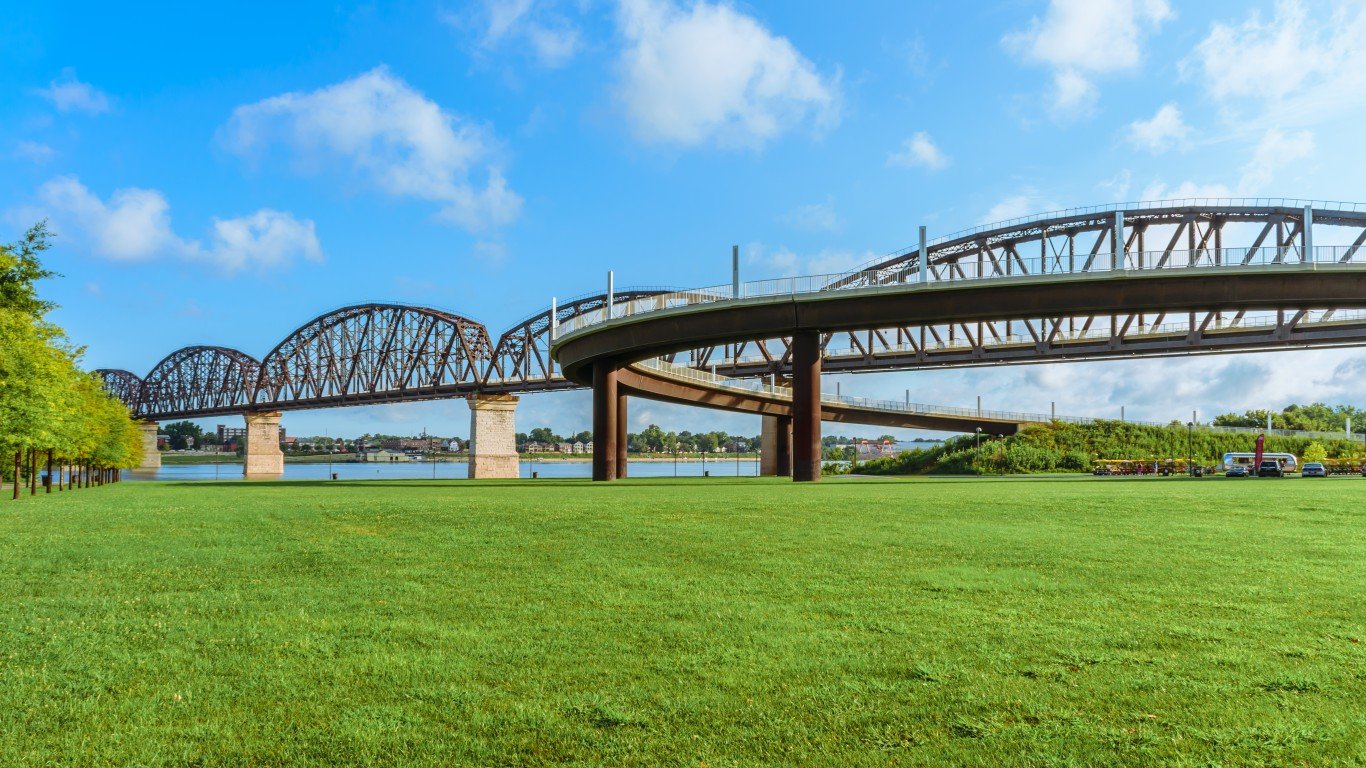
- Percent structurally deficient bridges, 2021: 6.87%
- Capital and bridge disbursements, 2020: $20,742 per lane-mile
- Expected capital and bridge disbursements, 2020: $30,817 per lane-mile
- Adjusted ratio: 0.67 — 14th highest
- State’s highway system overall rank: 7
- State-control highway miles: 62,346 — 8th highest
- Famous bridge in Kentucky: Big Four Bridge
24. Wisconsin
- Percent structurally deficient bridges, 2021: 6.90%
- Capital and bridge disbursements, 2020: $46,455 per lane-mile
- Expected capital and bridge disbursements, 2020: $43,833 per lane-mile
- Adjusted ratio: 1.06 — 22nd lowest
- State’s highway system overall rank: 33
- State-control highway miles: 29,806 — 19th highest
- Famous bridge in Wisconsin: Cedarburg Covered Bridge
23. Montana

- Percent structurally deficient bridges, 2021: 6.93%
- Capital and bridge disbursements, 2020: $20,961 per lane-mile
- Expected capital and bridge disbursements, 2020: $19,047 per lane-mile
- Adjusted ratio: 1.10 — 19th lowest
- State’s highway system overall rank: 25
- State-control highway miles: 25,211 — 25th lowest
- Famous bridge in Montana: Koocanusa Bridge
22. Mississippi
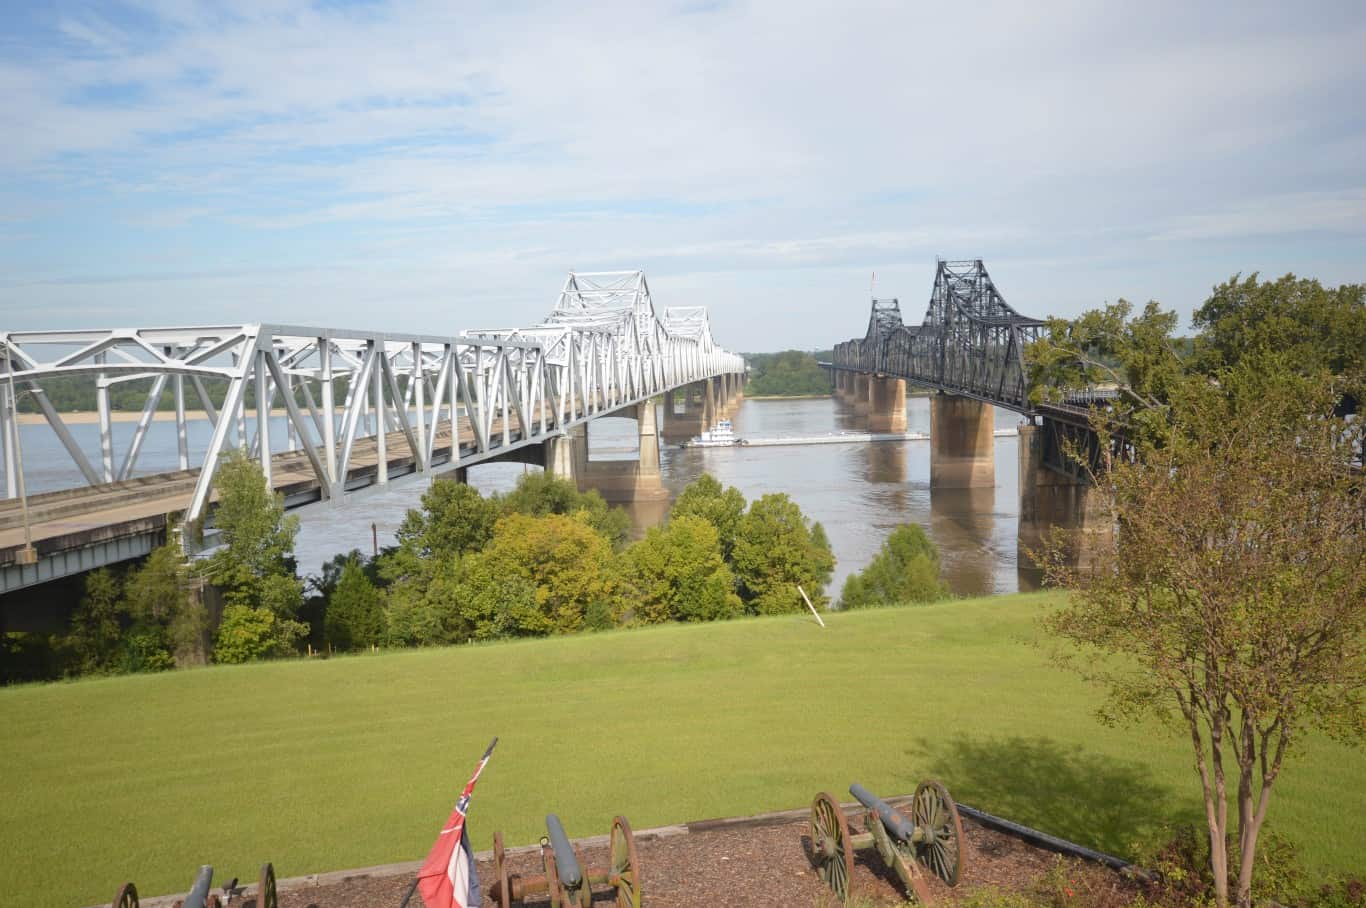
- Percent structurally deficient bridges, 2021: 6.99%
- Capital and bridge disbursements, 2020: $25,031 per lane-mile
- Expected capital and bridge disbursements, 2020: $33,554 per lane-mile
- Adjusted ratio: 0.75 — 17th highest
- State’s highway system overall rank: 18
- State-control highway miles: 28,310 — 24th highest
- Famous bridge in Mississippi: Old Vicksburg Bridge
21. North Carolina

- Percent structurally deficient bridges, 2021: 7.02%
- Capital and bridge disbursements, 2020: $27,897 per lane-mile
- Expected capital and bridge disbursements, 2020: $44,381 per lane-mile
- Adjusted ratio: 0.63 — 11th highest
- State’s highway system overall rank: 2
- State-control highway miles: 173,653 — 2nd highest
- Famous bridge in North Carolina: Mile High Swinging Bridge
20. New Jersey
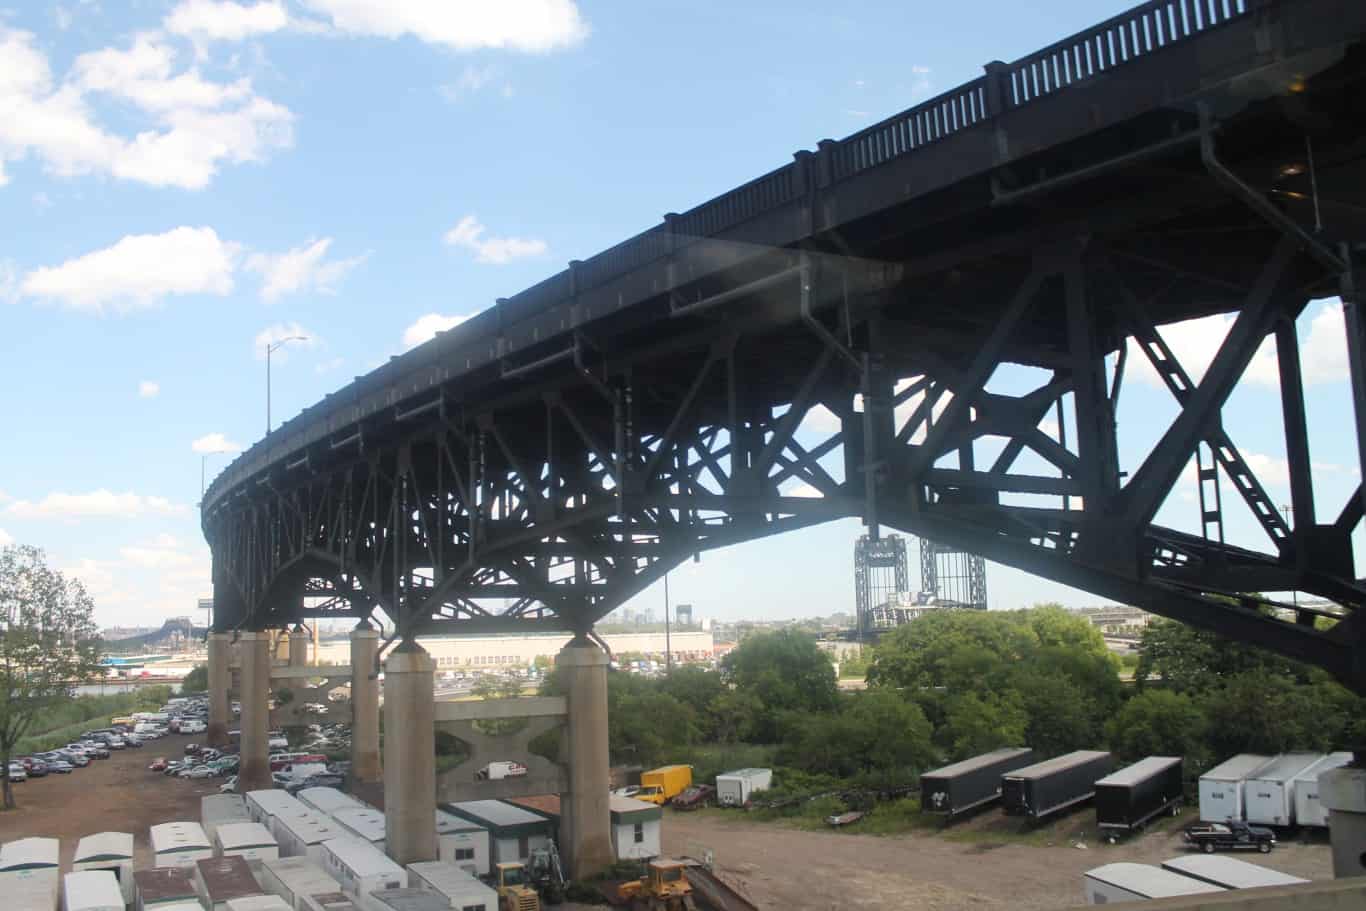
- Percent structurally deficient bridges, 2021: 7.09%
- Capital and bridge disbursements, 2020: $344,386 per lane-mile
- Expected capital and bridge disbursements, 2020: $225,160 per lane-mile
- Adjusted ratio: 1.53 — 6th lowest
- State’s highway system overall rank: 44
- State-control highway miles: 8,551 — 5th lowest
- Famous bridge in New Jersey: Pulaski Skyway
19. Wyoming
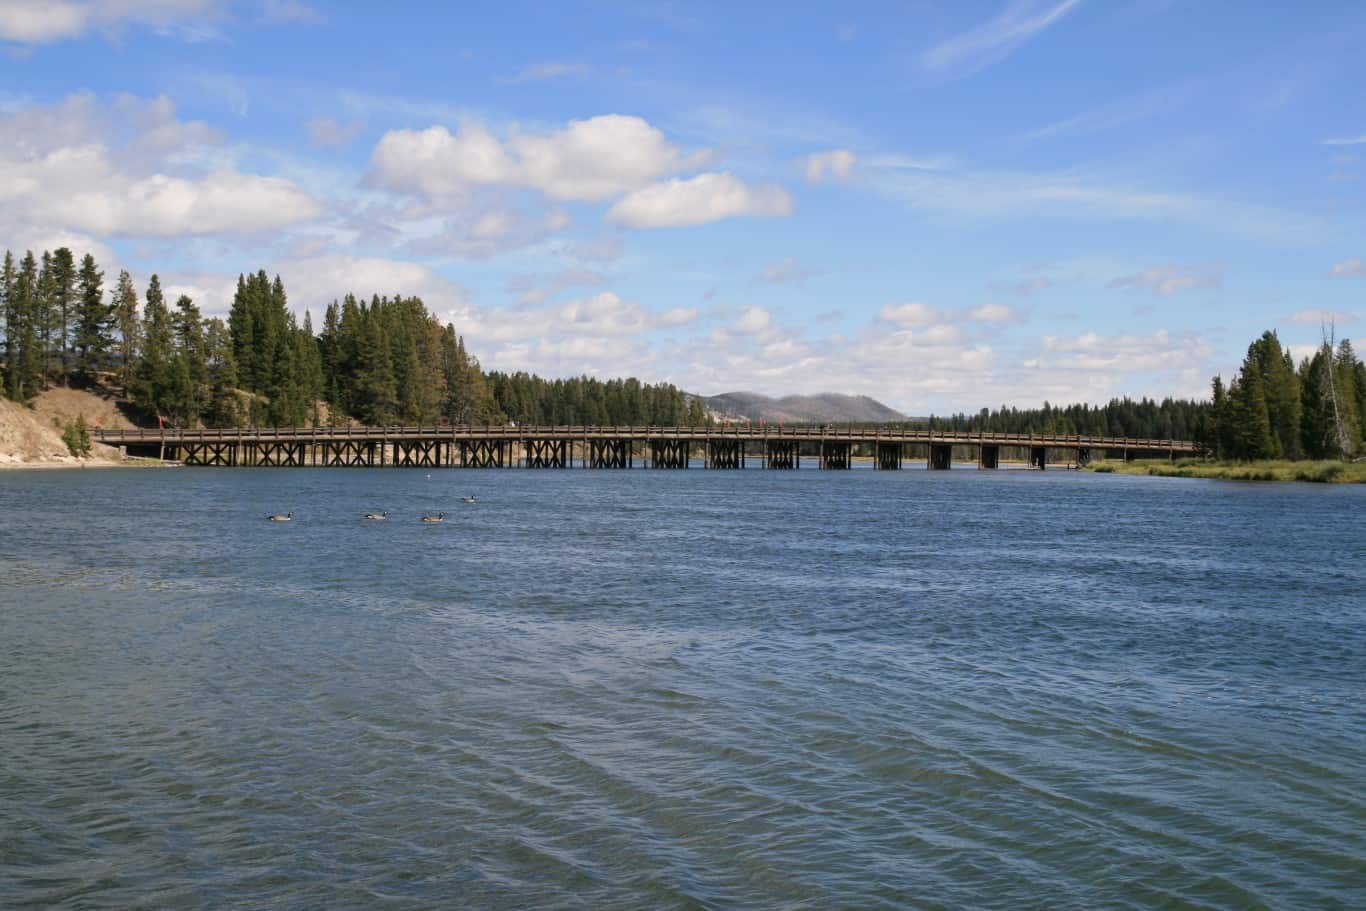
- Percent structurally deficient bridges, 2021: 7.39%
- Capital and bridge disbursements, 2020: $23,697 per lane-mile
- Expected capital and bridge disbursements, 2020: $23,913 per lane-mile
- Adjusted ratio: 0.99 — 25th lowest
- State’s highway system overall rank: 16
- State-control highway miles: 15,792 — 13th lowest
- Famous bridge in Wyoming: Fishing Bridge
18. Hawaii
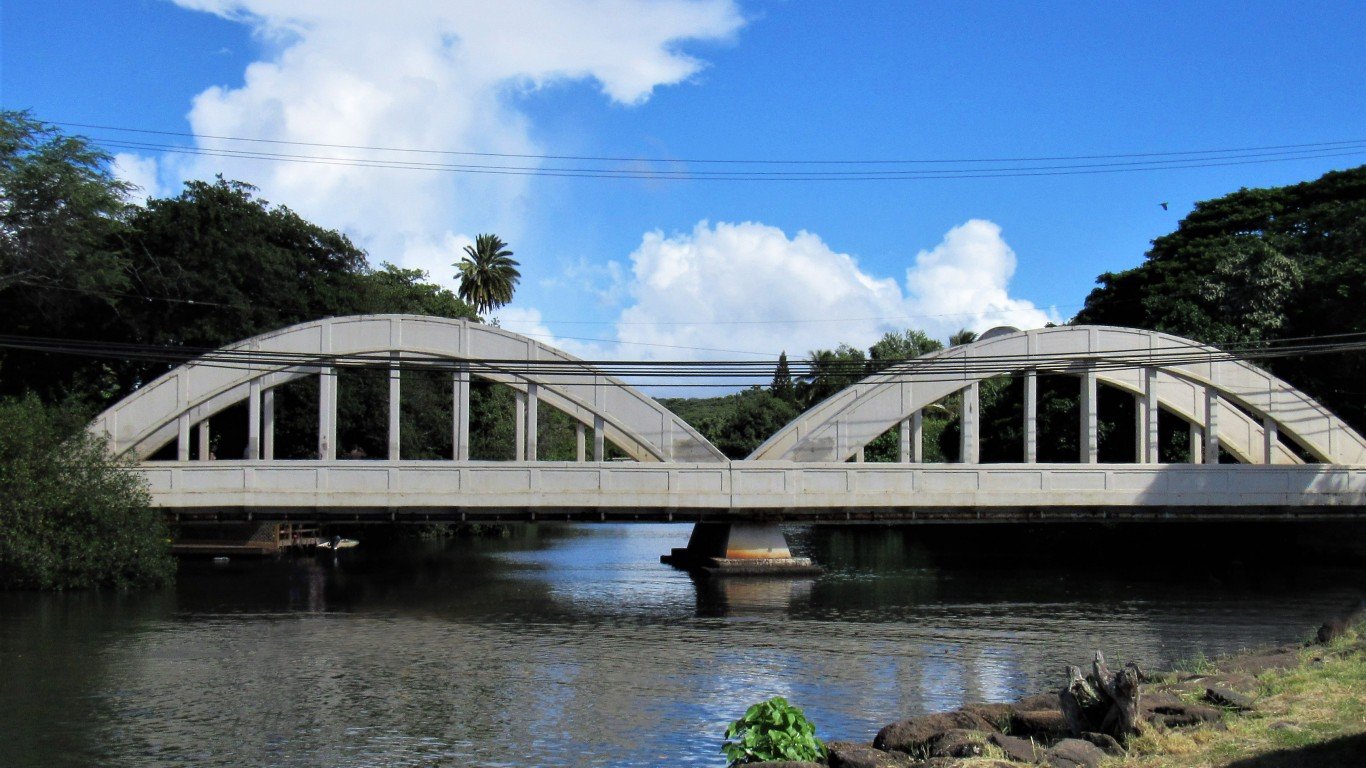
- Percent structurally deficient bridges, 2021: 7.49%
- Capital and bridge disbursements, 2020: $98,120 per lane-mile
- Expected capital and bridge disbursements, 2020: $99,817 per lane-mile
- Adjusted ratio: 0.98 — 25th highest
- State’s highway system overall rank: 48
- State-control highway miles: 2,477 — the lowest
- Famous bridge in Hawaii: Anahulu Stream Bridge
17. New Hampshire
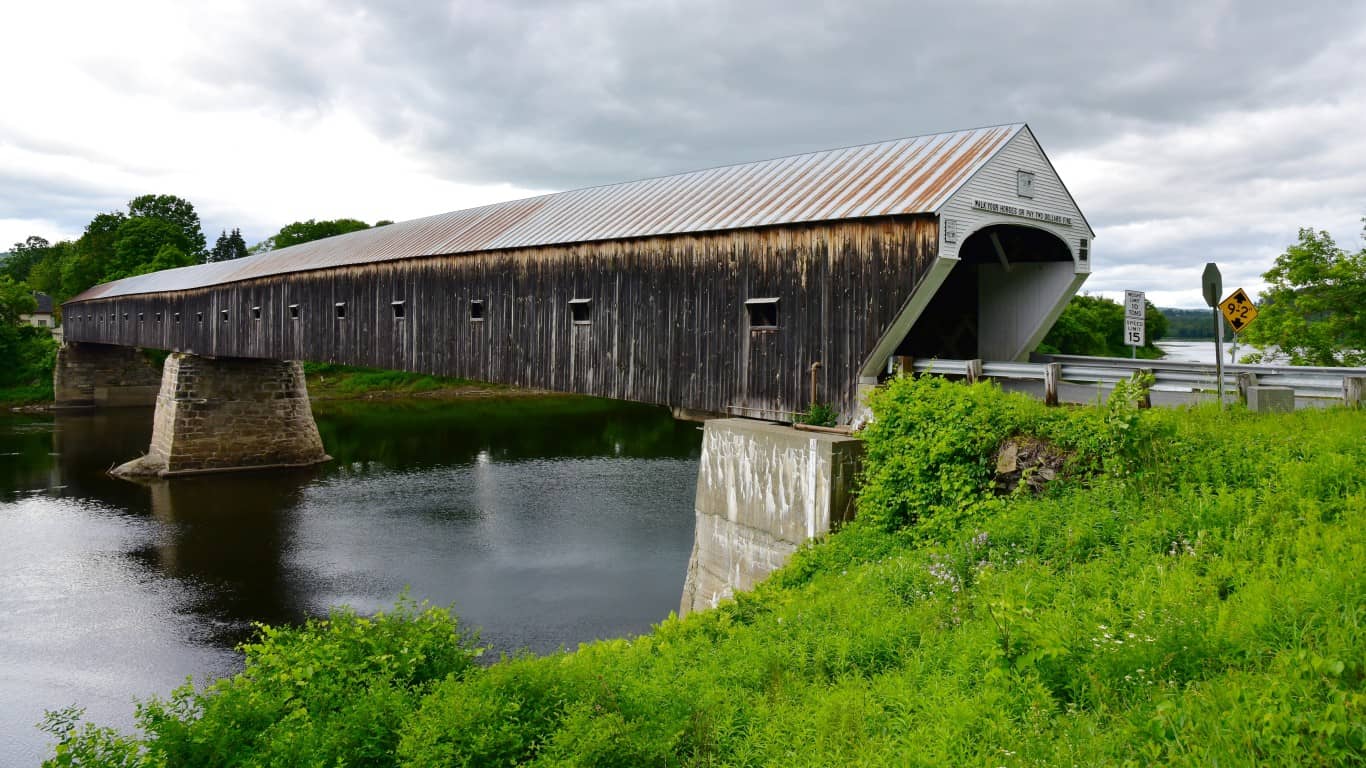
- Percent structurally deficient bridges, 2021: 7.68%
- Capital and bridge disbursements, 2020: $32,313 per lane-mile
- Expected capital and bridge disbursements, 2020: $37,664 per lane-mile
- Adjusted ratio: 0.86 — 19th highest
- State’s highway system overall rank: 14
- State-control highway miles: 8,453 — 4th lowest
- Famous bridge in New Hampshire: Cornish-Windsor Covered Bridge
16. Alaska
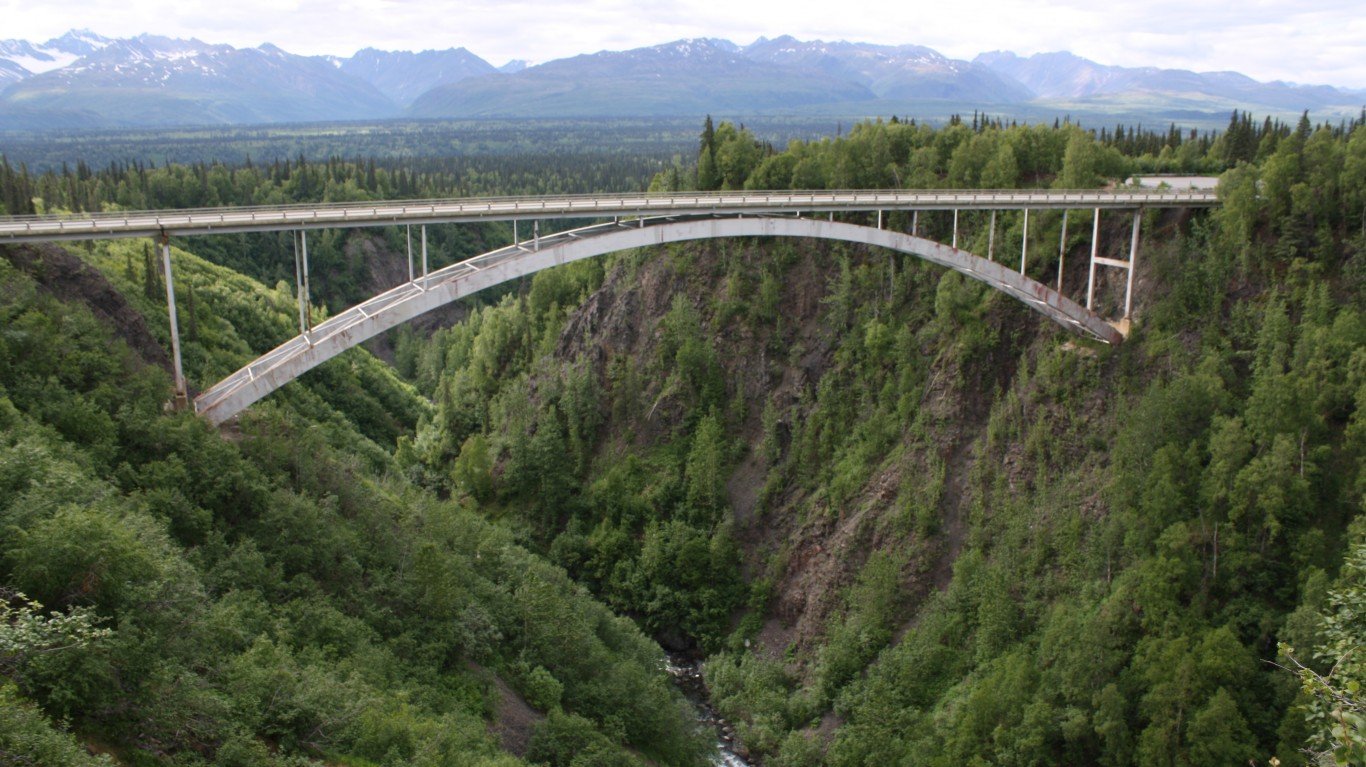
- Percent structurally deficient bridges, 2021: 8.21%
- Capital and bridge disbursements, 2020: $65,303 per lane-mile
- Expected capital and bridge disbursements, 2020: $31,277 per lane-mile
- Adjusted ratio: 2.09 — 2nd lowest
- State’s highway system overall rank: 50
- State-control highway miles: 11,754 — 8th lowest
- Famous bridge in Alaska: Hurricane Gulch Bridge
15. Nebraska
- Percent structurally deficient bridges, 2021: 8.34%
- Capital and bridge disbursements, 2020: $21,452 per lane-mile
- Expected capital and bridge disbursements, 2020: $22,276 per lane-mile
- Adjusted ratio: 0.96 — 24th highest
- State’s highway system overall rank: 26
- State-control highway miles: 22,541 — 21st lowest
- Famous bridge in Nebraska: Bob Kerrey Pedestrian Bridge
14. Massachusetts
- Percent structurally deficient bridges, 2021: 8.69%
- Capital and bridge disbursements, 2020: $91,830 per lane-mile
- Expected capital and bridge disbursements, 2020: $207,833 per lane-mile
- Adjusted ratio: 0.44 — 3rd highest
- State’s highway system overall rank: 20
- State-control highway miles: 9,556 — 6th lowest
- Famous bridge in Massachusetts: Bridge of Flowers
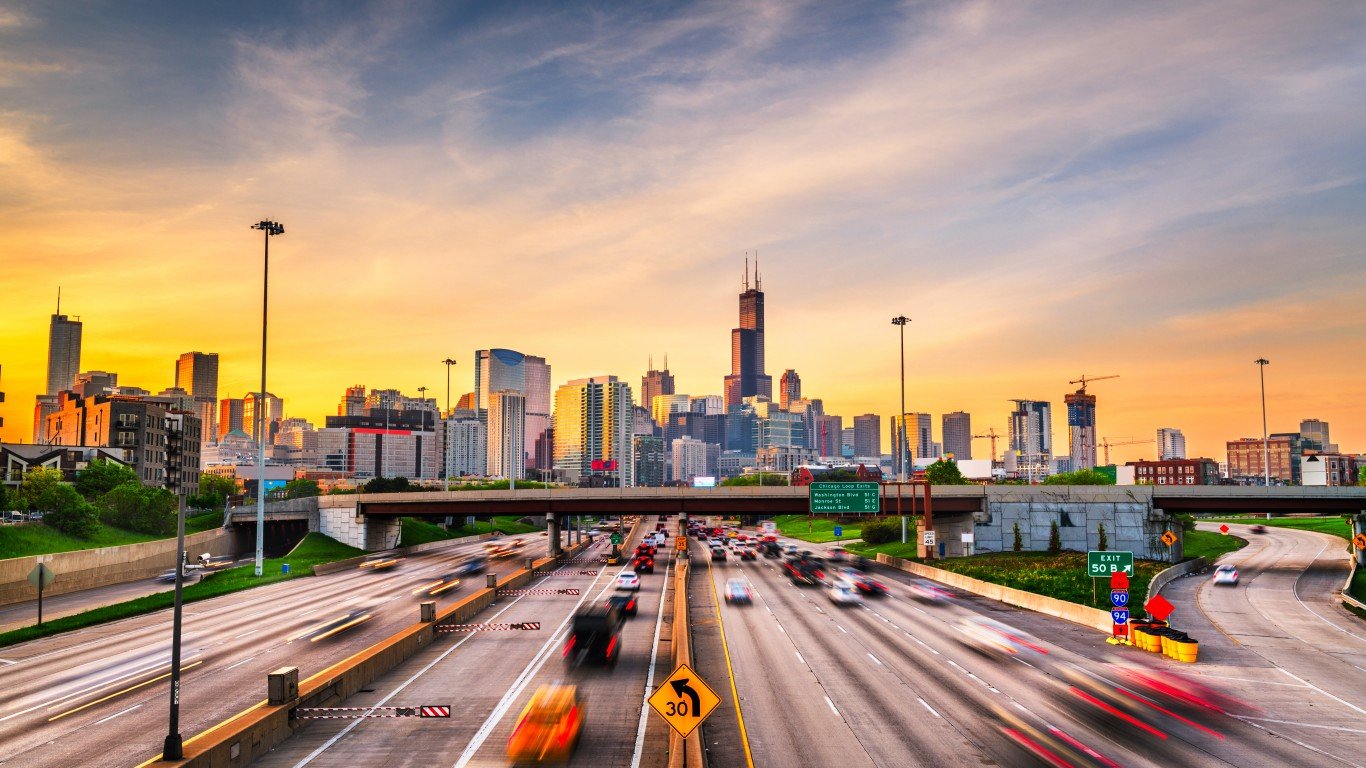
13. Illinois

- Percent structurally deficient bridges, 2021: 8.96%
- Capital and bridge disbursements, 2020: $74,606 per lane-mile
- Expected capital and bridge disbursements, 2020: $63,747 per lane-mile
- Adjusted ratio: 1.17 — 17th lowest
- State’s highway system overall rank: 29
- State-control highway miles: 42,169 — 13th highest
- Famous bridge in Illinois: DuSable Bridge
12. Missouri
- Percent structurally deficient bridges, 2021: 9.02%
- Capital and bridge disbursements, 2020: $10,364 per lane-mile
- Expected capital and bridge disbursements, 2020: $30,406 per lane-mile
- Adjusted ratio: 0.34 — 2nd highest
- State’s highway system overall rank: 11
- State-control highway miles: 77,693 — 6th highest
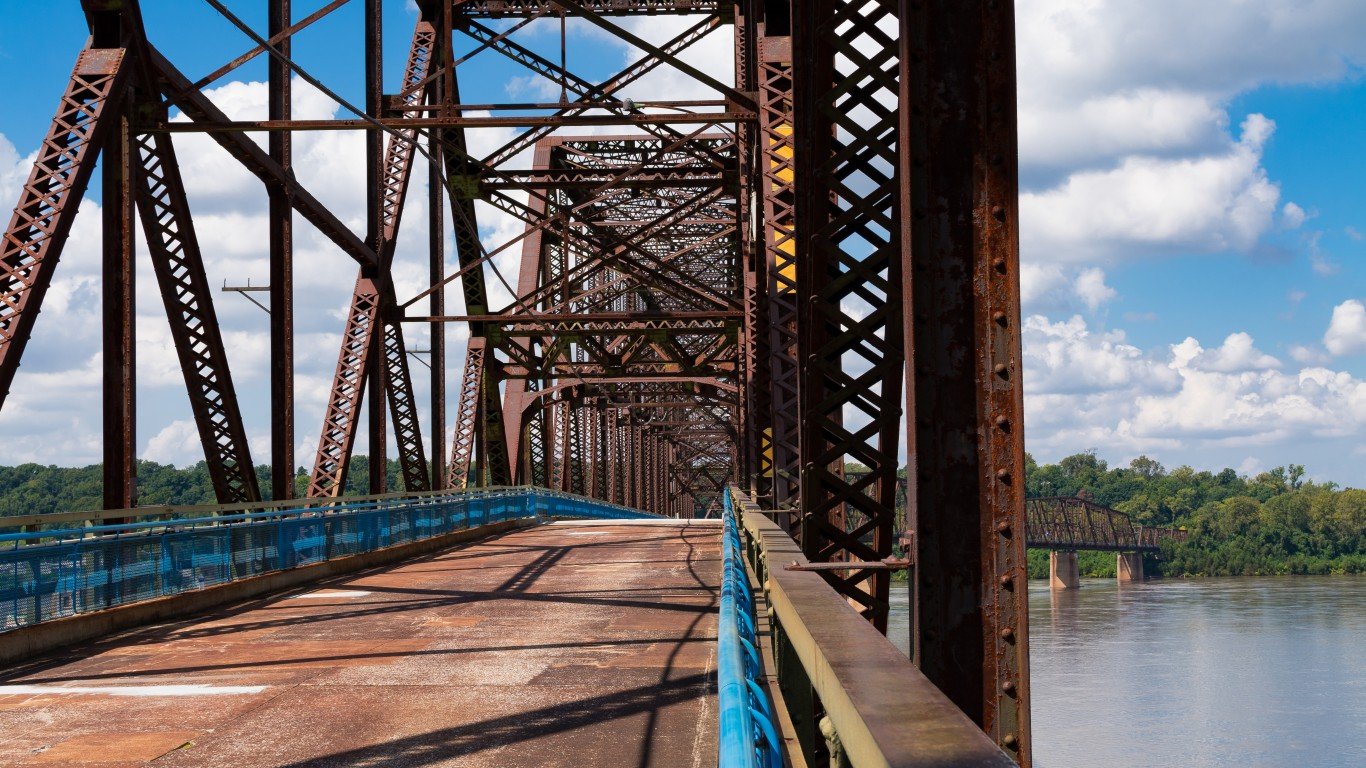
- Famous bridge in Missouri: Chain of Rocks Bridge
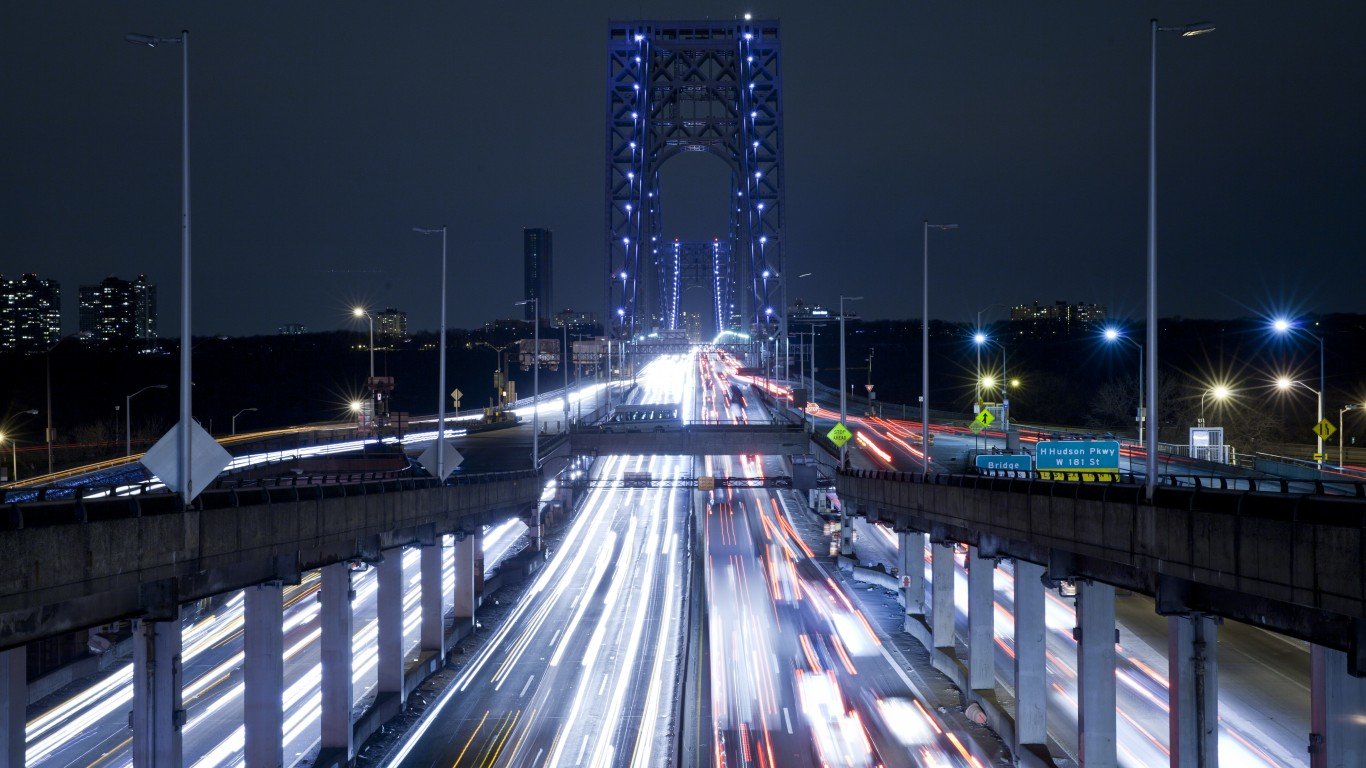
11. New York

- Percent structurally deficient bridges, 2021: 9.52%
- Capital and bridge disbursements, 2020: $103,205 per lane-mile
- Expected capital and bridge disbursements, 2020: $65,611 per lane-mile
- Adjusted ratio: 1.57 — 4th lowest
- State’s highway system overall rank: 49
- State-control highway miles: 38,157 — 15th highest
- Famous bridge in New York: Brooklyn Bridge
10. Oklahoma

- Percent structurally deficient bridges, 2021: 9.89%
- Capital and bridge disbursements, 2020: $44,728 per lane-mile
- Expected capital and bridge disbursements, 2020: $33,958 per lane-mile
- Adjusted ratio: 1.32 — 10th lowest
- State’s highway system overall rank: 45
- State-control highway miles: 30,407 — 18th highest
- Famous bridge in Oklahoma: Skydance Bridge
9. Michigan
- Percent structurally deficient bridges, 2021: 10.99%
- Capital and bridge disbursements, 2020: $53,110 per lane-mile
- Expected capital and bridge disbursements, 2020: $60,894 per lane-mile
- Adjusted ratio: 0.87 — 20th highest
- State’s highway system overall rank: 27
- State-control highway miles: 27,366 — 25th highest
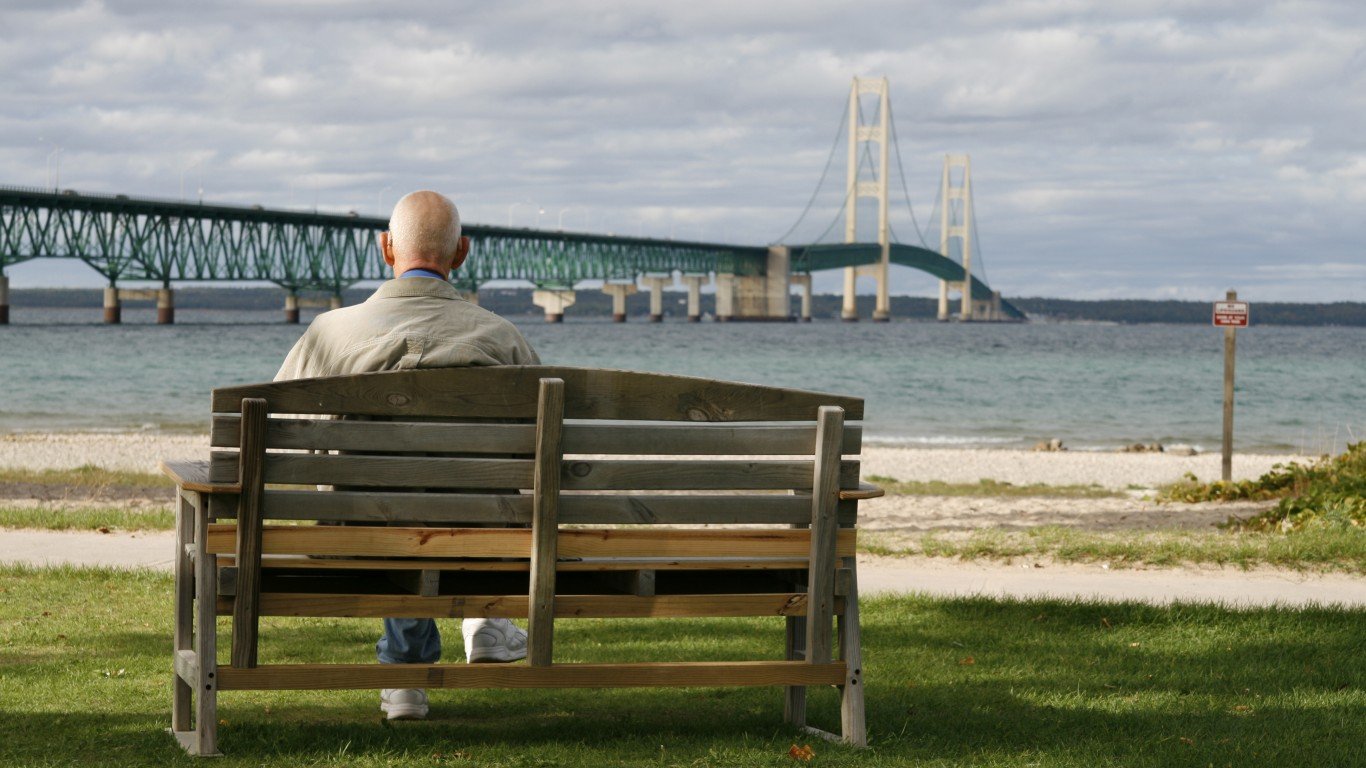
- Famous bridge in Michigan: Mackinac Bridge
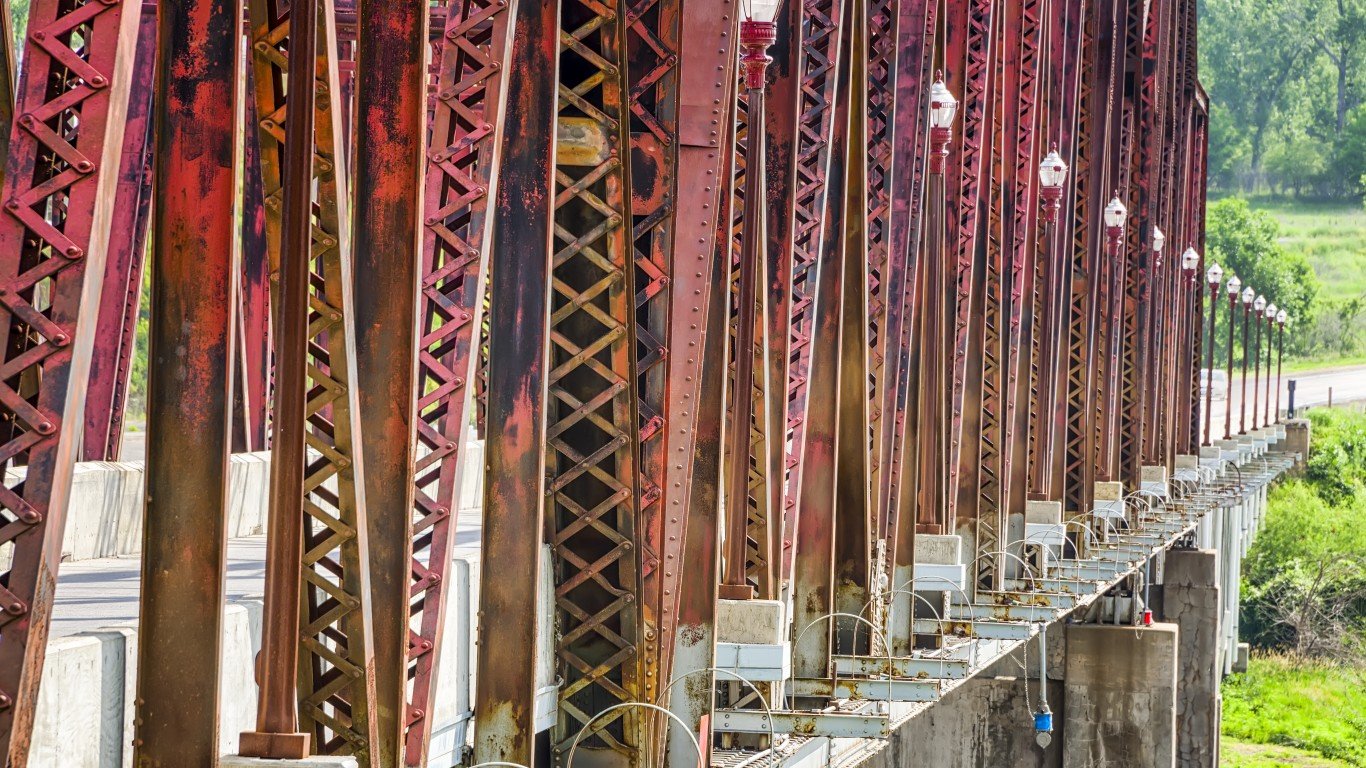
8. North Dakota
- Percent structurally deficient bridges, 2021: 11.23%
- Capital and bridge disbursements, 2020: $21,820 per lane-mile
- Expected capital and bridge disbursements, 2020: $17,458 per lane-mile
- Adjusted ratio: 1.25 — 13th lowest
- State’s highway system overall rank: 9
- State-control highway miles: 17,245 — 15th lowest
- Famous bridge in North Dakota: Hi-Line Bridge
7. Maine
- Percent structurally deficient bridges, 2021: 12.64%
- Capital and bridge disbursements, 2020: $27,840 per lane-mile
- Expected capital and bridge disbursements, 2020: $29,198 per lane-mile
- Adjusted ratio: 0.95 — 23rd highest
- State’s highway system overall rank: 32
- State-control highway miles: 17,467 — 16th lowest
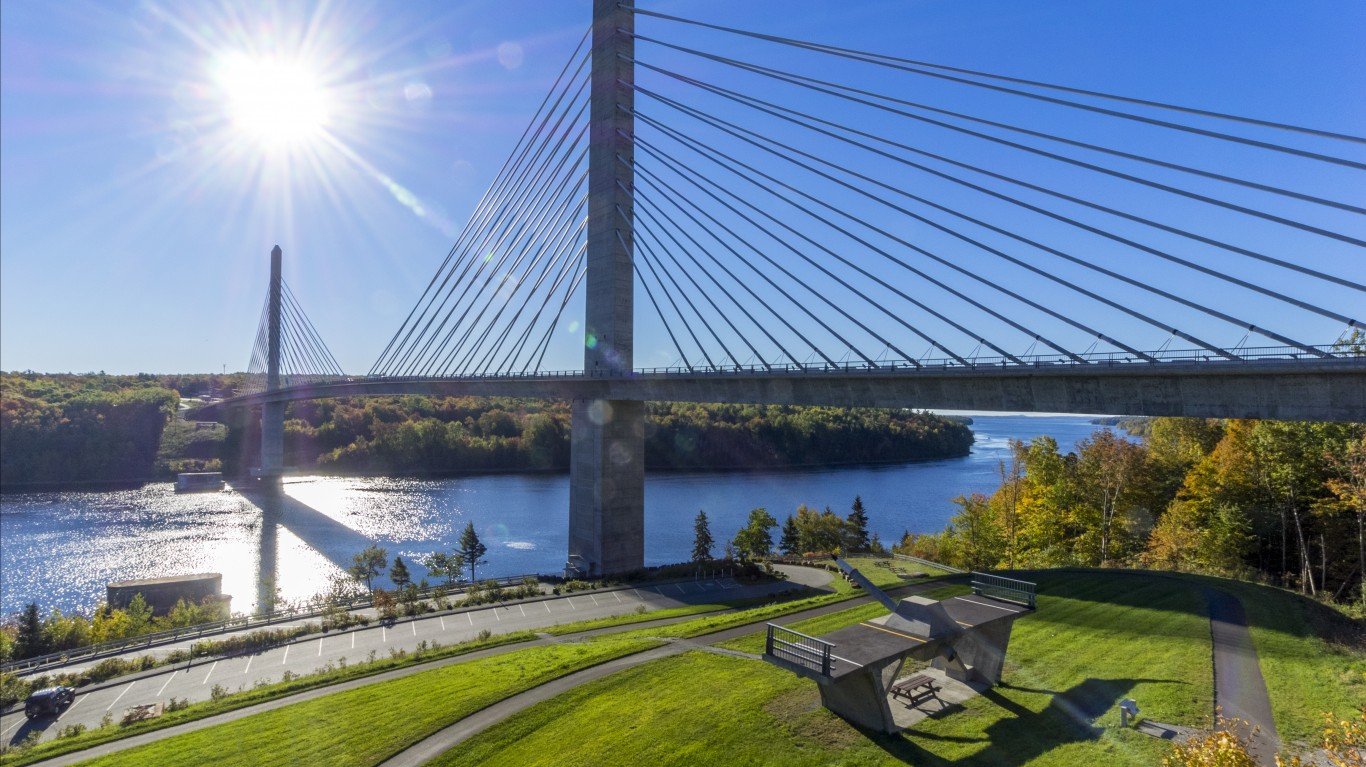
- Famous bridge in Maine: Penobscot Narrows Bridge
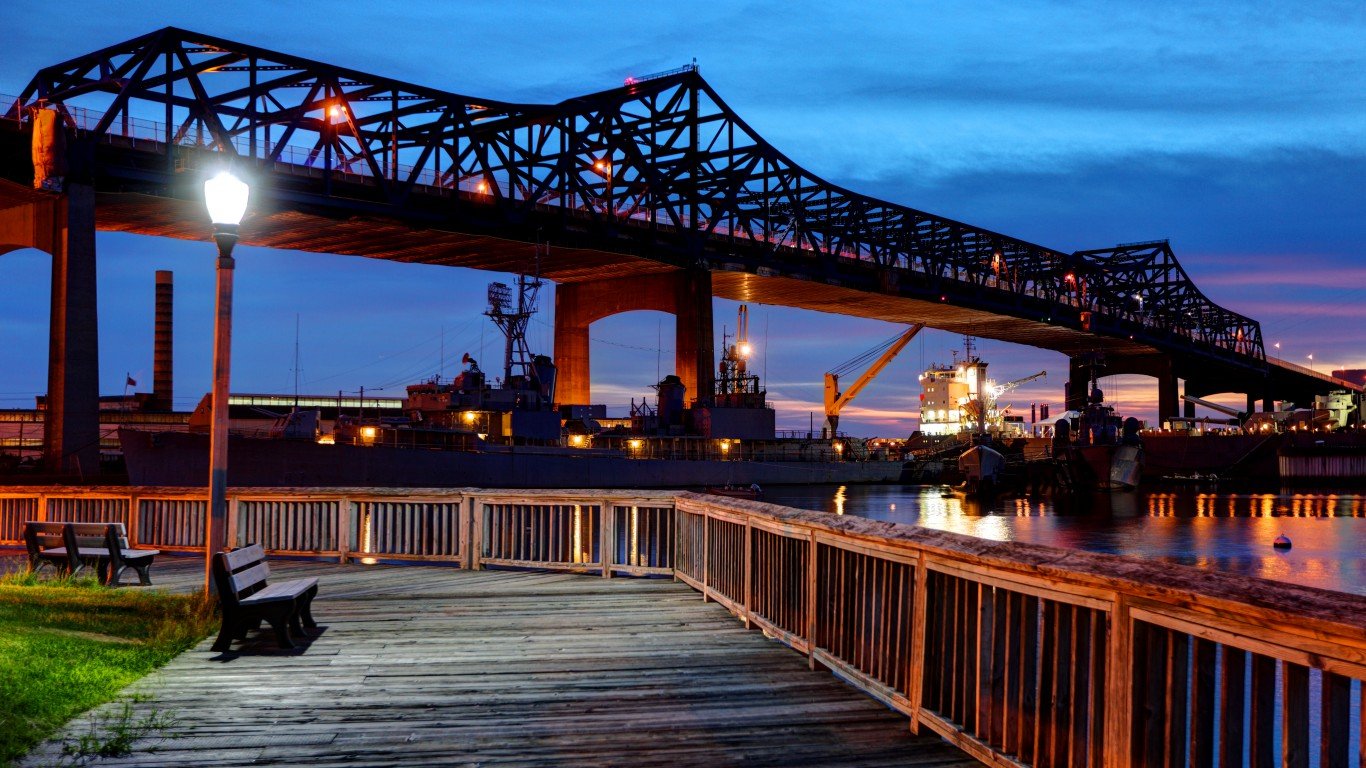
6. Louisiana
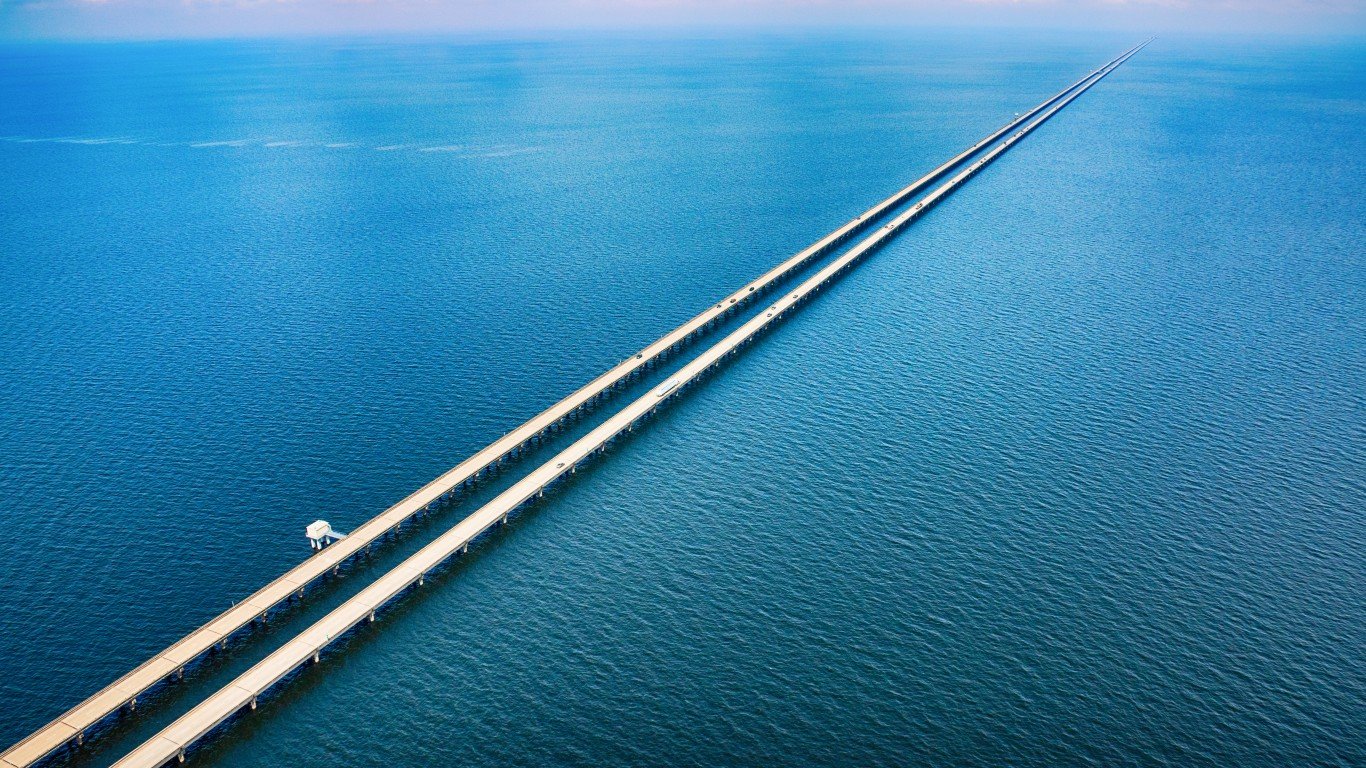
- Percent structurally deficient bridges, 2021: 12.76%
- Capital and bridge disbursements, 2020: $22,084 per lane-mile
- Expected capital and bridge disbursements, 2020: $44,370 per lane-mile
- Adjusted ratio: 0.50 — 6th highest
- State’s highway system overall rank: 40
- State-control highway miles: 40,154 — 14th highest
- Famous bridge in Louisiana: Lake Pontchartrain Causeway
5. Pennsylvania
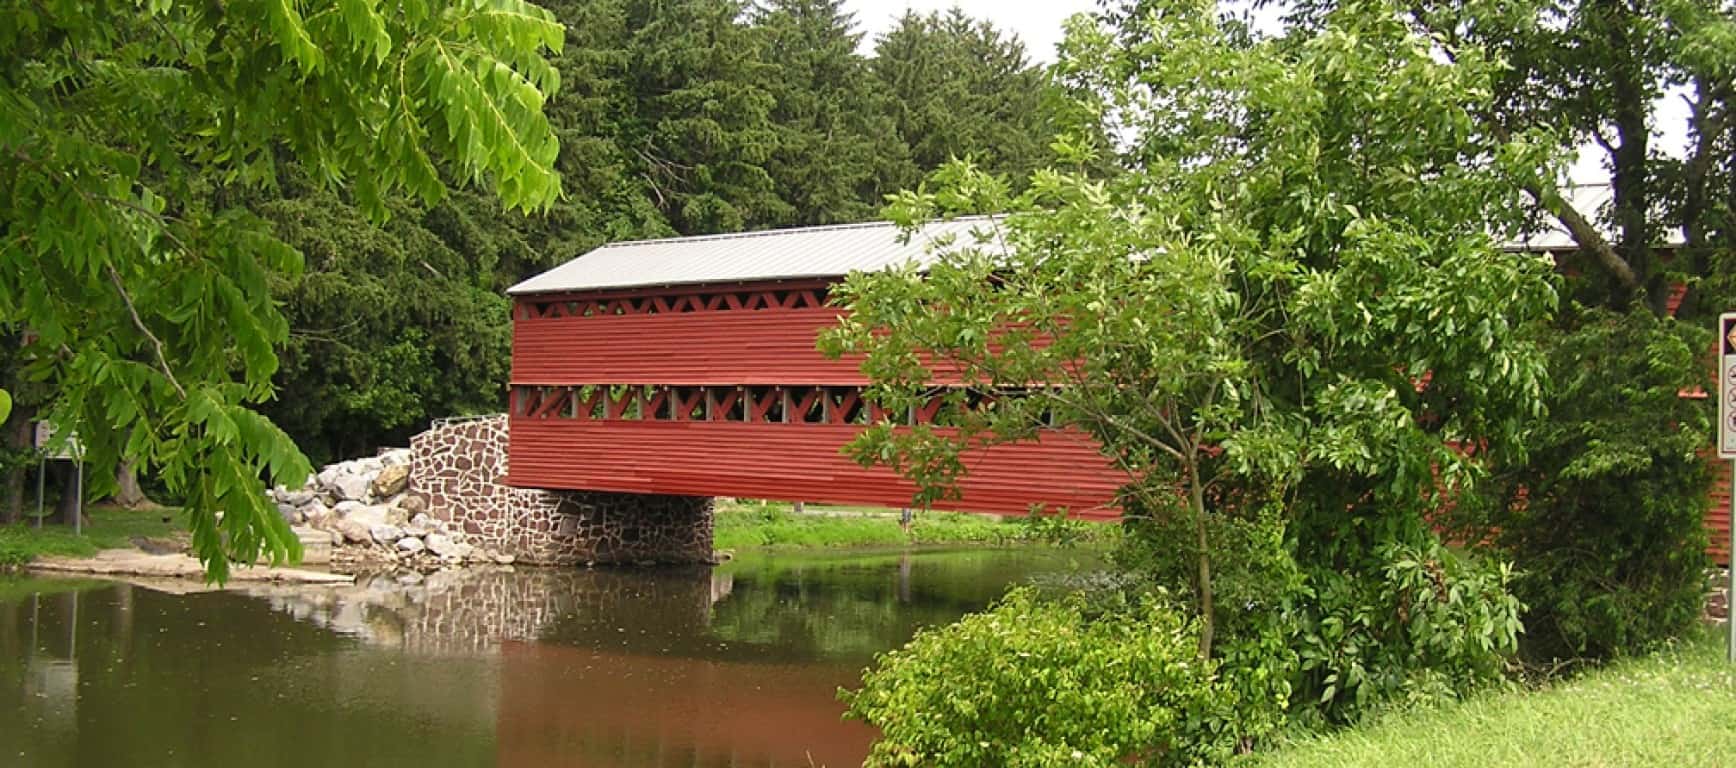
- Percent structurally deficient bridges, 2021: 13.80%
- Capital and bridge disbursements, 2020: $43,217 per lane-mile
- Expected capital and bridge disbursements, 2020: $47,341 per lane-mile
- Adjusted ratio: 0.91 — 21st highest
- State’s highway system overall rank: 41
- State-control highway miles: 88,322 — 5th highest
- Famous bridge in Pennsylvania: Sachs Covered Bridge
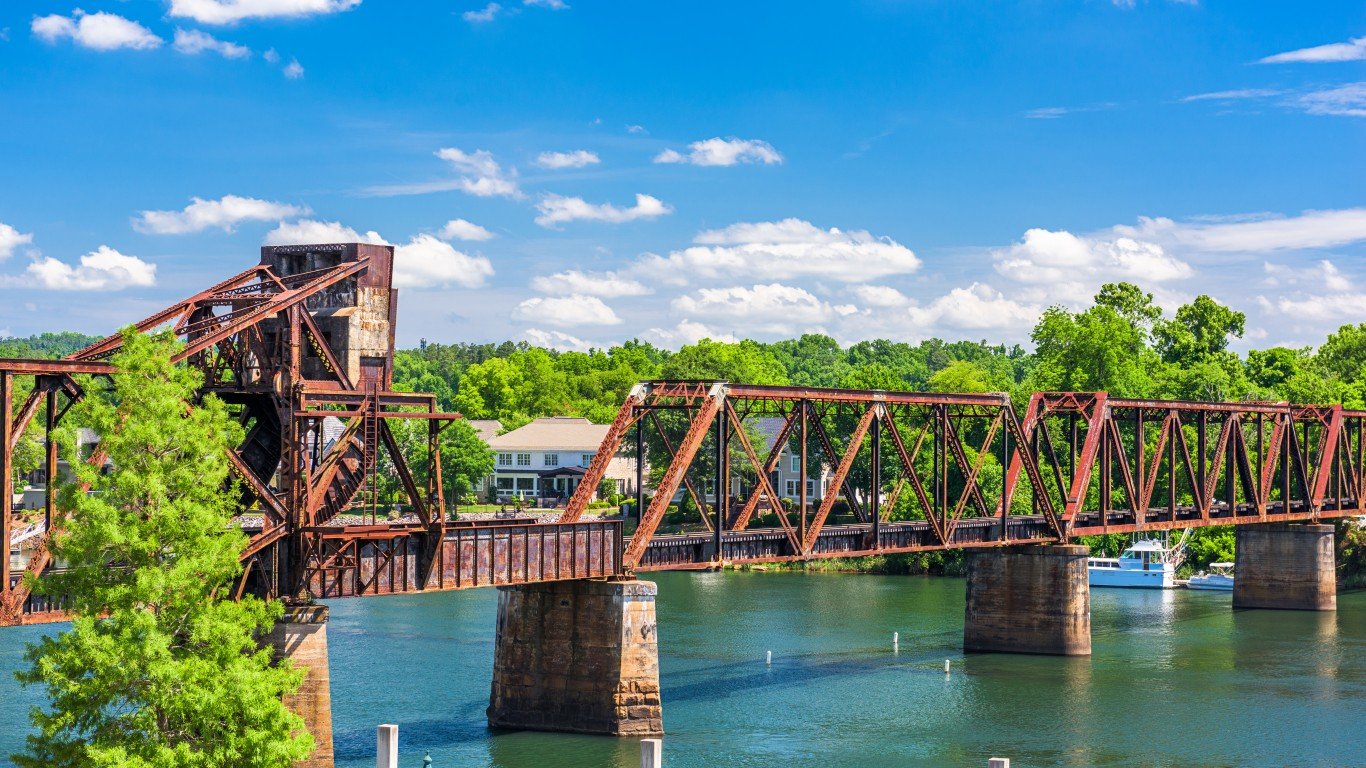
4. South Dakota
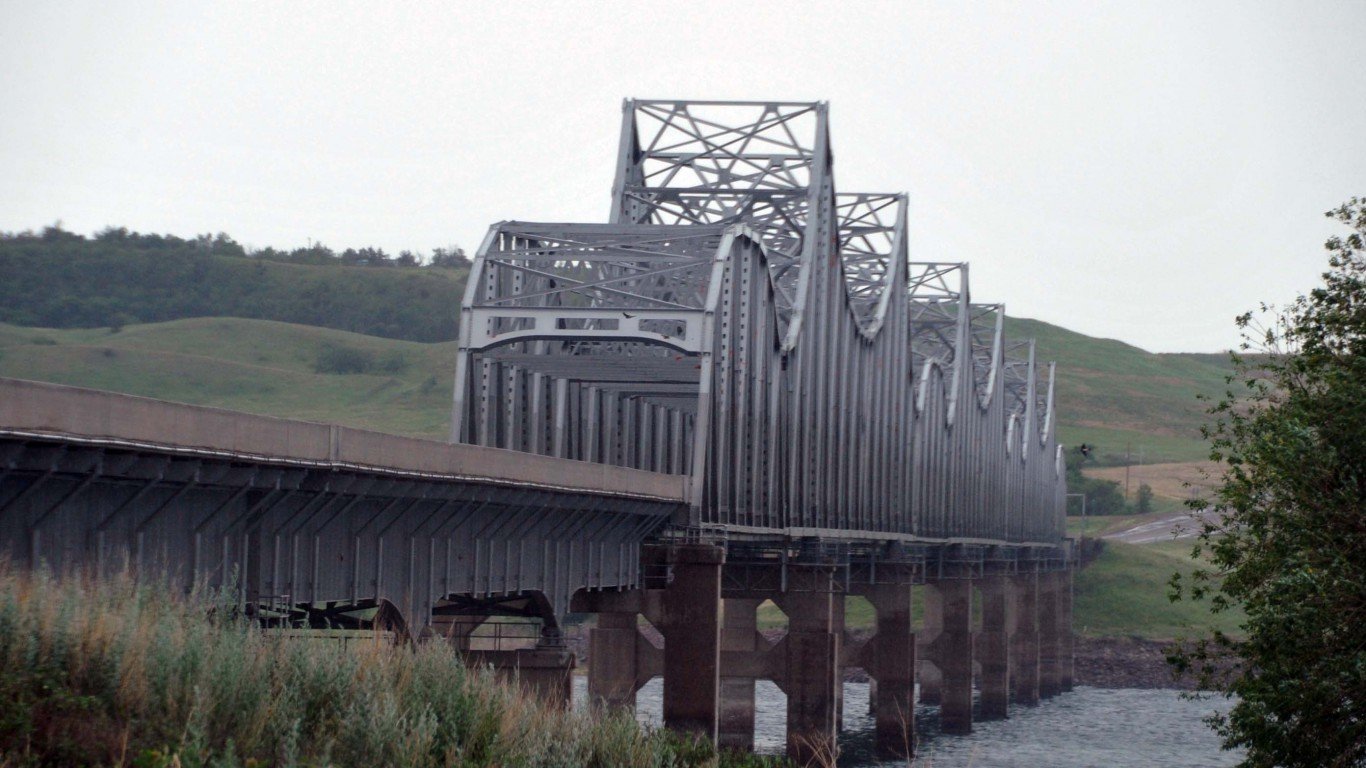
- Percent structurally deficient bridges, 2021: 17.30%
- Capital and bridge disbursements, 2020: $13,696 per lane-mile
- Expected capital and bridge disbursements, 2020: $18,126 per lane-mile
- Adjusted ratio: 0.76 — 18th highest
- State’s highway system overall rank: 28
- State-control highway miles: 17,955 — 17th lowest
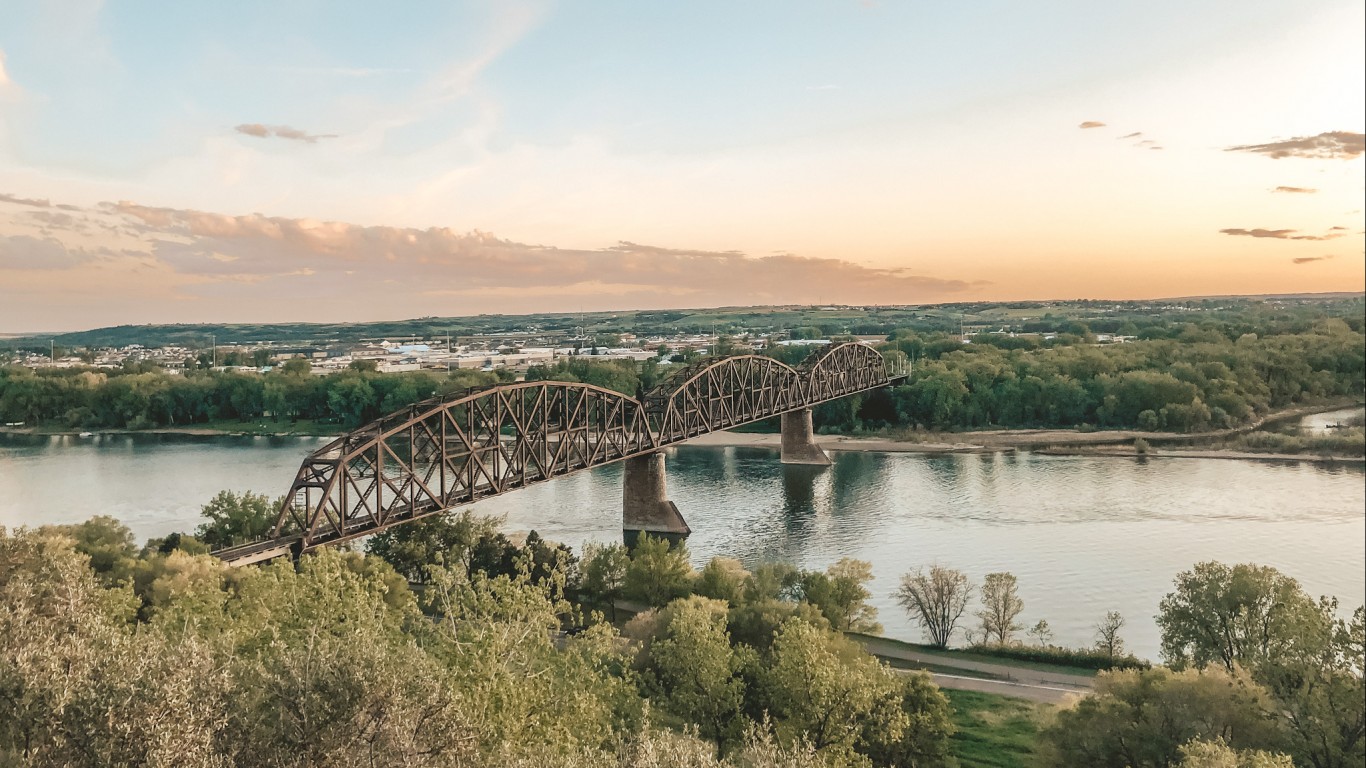
- Famous bridge in South Dakota: Chamberlain Rail Bridge
3. Rhode Island
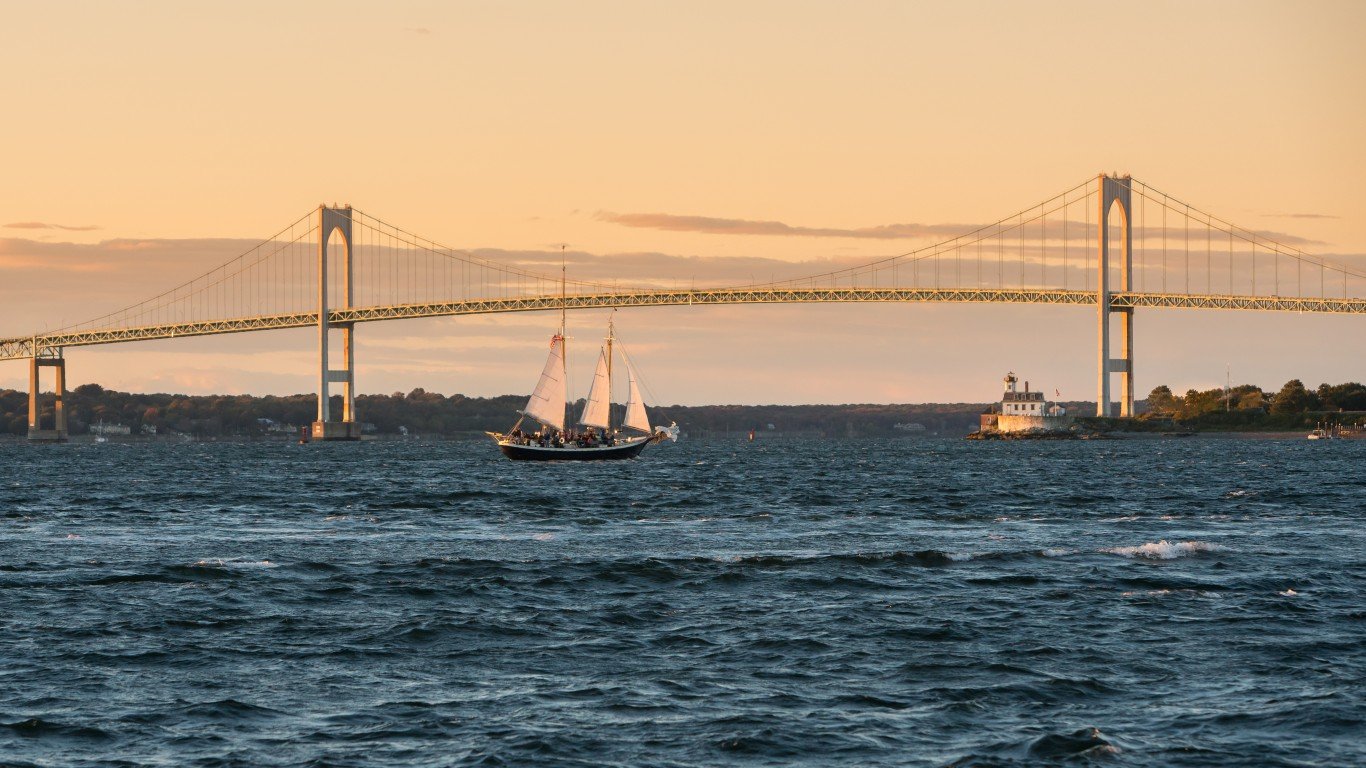
- Percent structurally deficient bridges, 2021: 17.46%
- Capital and bridge disbursements, 2020: $124,081 per lane-mile
- Expected capital and bridge disbursements, 2020: $132,030 per lane-mile
- Adjusted ratio: 0.94 — 22nd highest
- State’s highway system overall rank: 42
- State-control highway miles: 2,870 — 2nd lowest
- Famous bridge in Rhode Island: Claiborne Pell Bridge
2. Iowa
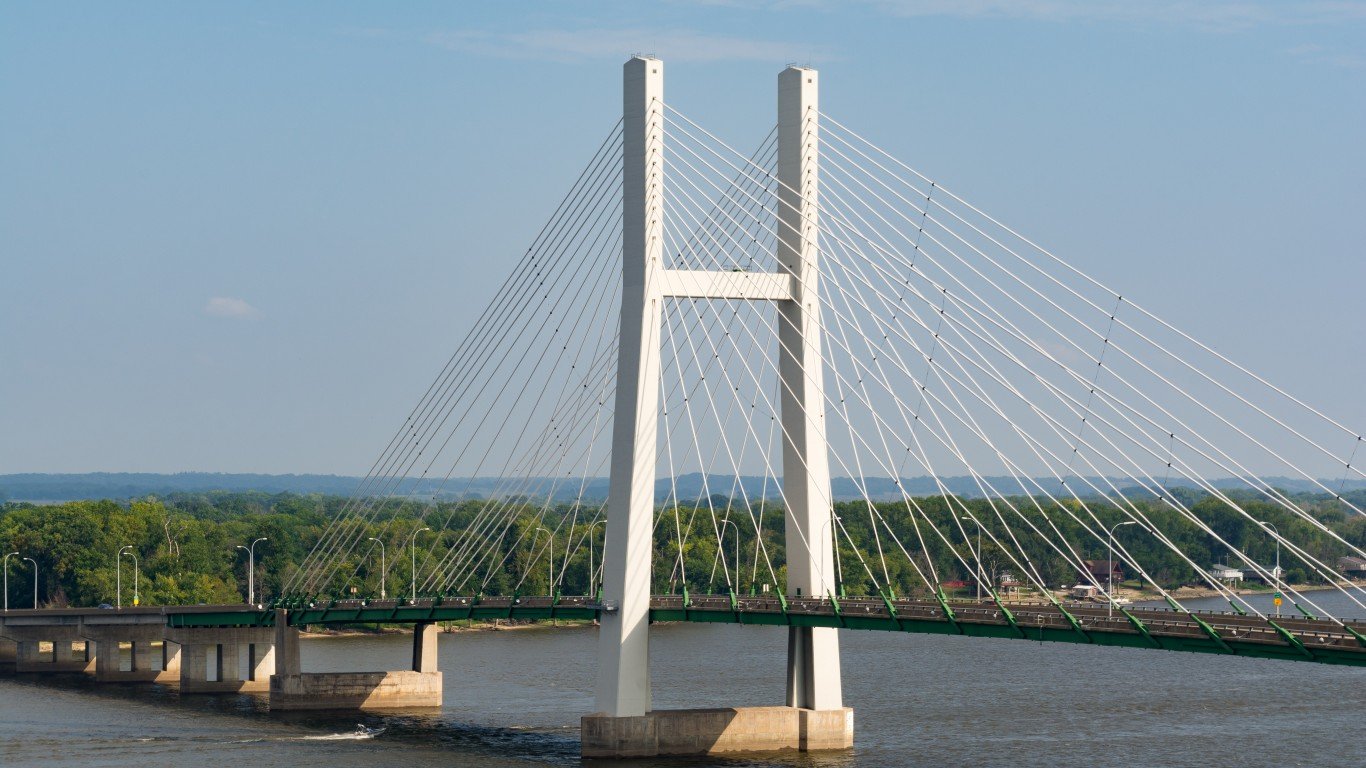
- Percent structurally deficient bridges, 2021: 18.87%
- Capital and bridge disbursements, 2020: $44,132 per lane-mile
- Expected capital and bridge disbursements, 2020: $33,116 per lane-mile
- Adjusted ratio: 1.33 — 9th lowest
- State’s highway system overall rank: 31
- State-control highway miles: 22,918 — 22nd lowest
- Famous bridge in Iowa: Kate Shelley High Bridge
1. West Virginia
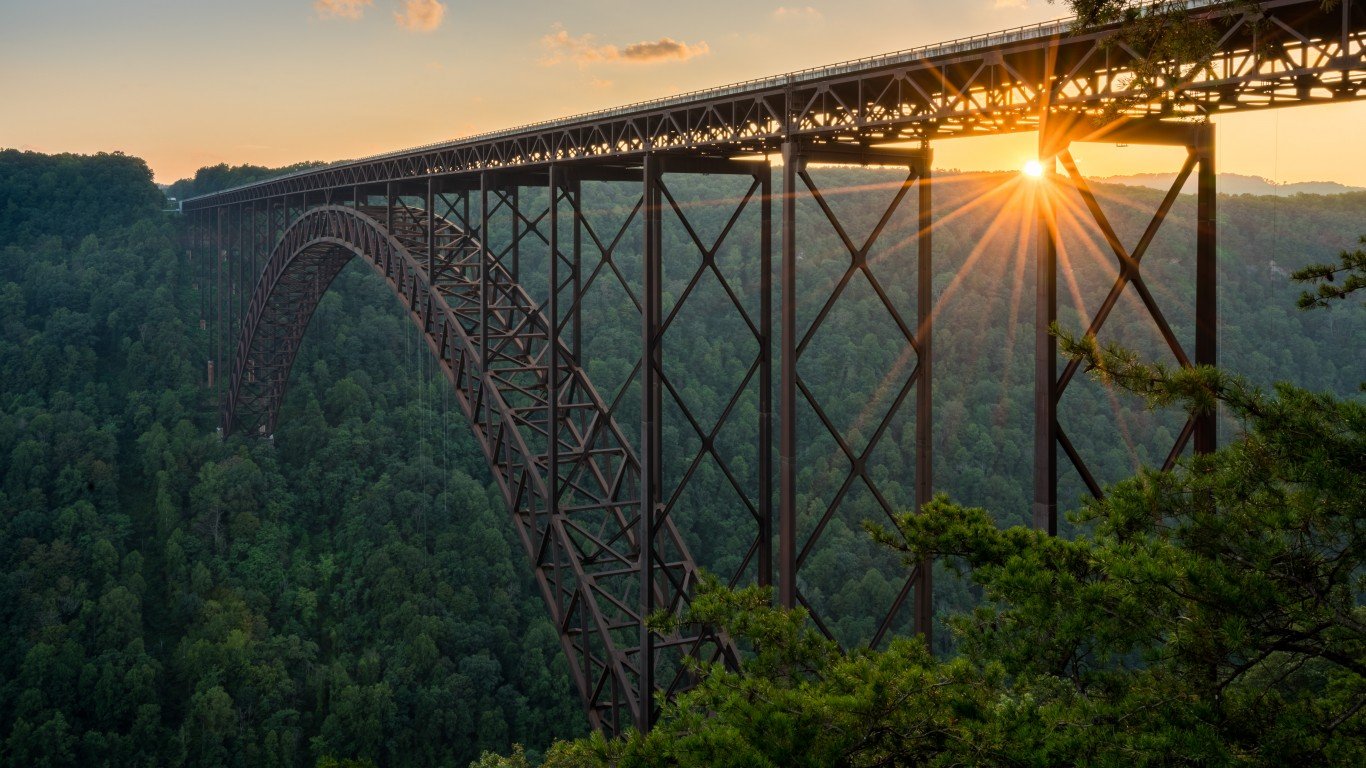
- Percent structurally deficient bridges, 2021: 20.37%
- Capital and bridge disbursements, 2020: $12,820 per lane-mile
- Expected capital and bridge disbursements, 2020: $28,193 per lane-mile
- Adjusted ratio: 0.45 — 4th highest
- State’s highway system overall rank: 39
- State-control highway miles: 71,054 — 7th highest
- Famous bridge in West Virginia: New River Gorge Bridge
Contact [email protected] for any questions or corrections.