June is nearing its end and the stock market’s recovery along with the overall economic reports have been nearly unimaginable. Employers, investors, day traders, economists and those who are looking at financial opportunities must consider what the movement in the stock market and other financial markets are trying to signal about the economy ahead. Current events and future events are unfolding and there are many charts and graphics that are trying to offer some insight into what is coming down the road.
Sometimes the best way to look at a market and other indexes is to look at charts and graphs. 24/7 Wall St. has created a weekly review of some of the best charts, tables, graphics and other images that should be given deep consideration for the coming days (or longer) based on those readings. And without trying to sound too forceful, anyone who has their assets in stocks, bonds or other asset classes better have an understanding of what the markets are trying to signal.
Even before the economic numbers started to improve to a “less bad” situation, the stock market and interest rates are signaling that things are not going to be as bad in the coming months versus what was seen in prior months. That could be derailed if the rapid rise in COVID-19 cases keeps surging, but government leaders have thus far indicated that another full economic shutdown should not be expected.
For the week that ended on June 19, there are some critical levels that need to be given strong consideration for the week of June 22 to June 26. And it is important to grasp that the election is now nearing five months away.
[nativounit]
The stock market may have sold off on Friday, but the indexes have recovered the bulk of their losses after the panic selling ended in March. Trillions of dollars in stimulus money have been thrown at the economy, and the Federal Reserve has issued a proclamation that short-term interest rates are going to remain low until the economy is back on its way to full employment.
We have first covered the S&P 500, a look at the Invesco QQQ Trust (NASDAQ: QQQ), Gold, Apple Inc. (NASDAQ: AAPL | AAPL Price Prediction), The Kraft Heinz Company (NASDAQ: KHC), and Crude Oil. We have also given a look at the wild explosive move higher in Urban One, inc. (NASDAQ: UONE) that has been seen in recent days. A special note was also provided around the COVID-19 cases, with the rising cases and current decline in number of deaths.
A brief commentary has been provided on each chart and graphic, as has the source of each item featured. These are not meant to be ranked in any particular order as some charts will be more important to some people than they are to other people.
Here are the 9 top charts we are seeing heading into the week of June 22 to June 26, 2020.
The S&P 500 Warning: Must Have Reasons for Longs & Shorts Alike
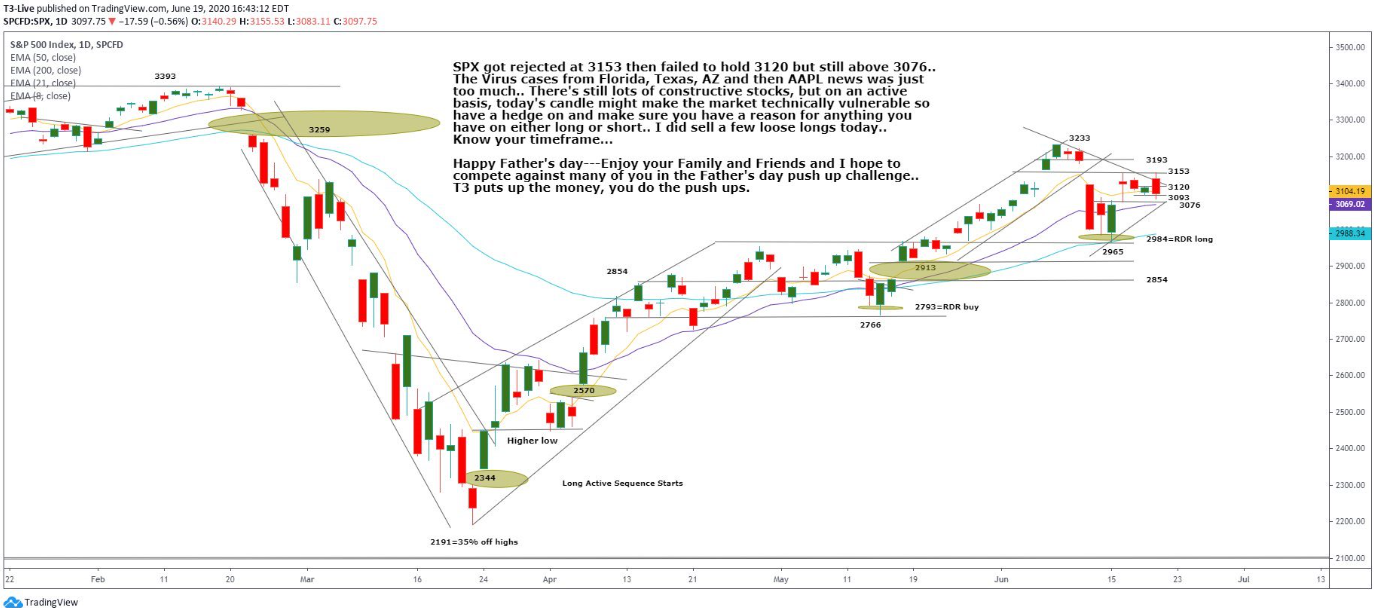
A new fresh chart for the S&P 500 in the week ahead offers some good takes here. As the S&P reached 1% or so over the 3,200 handles then the gap down from February after the highs that led into the March panic selling came directly into play.
So here is your chart from Scott Redler on Twitter for his T3 trading service, and don’t ignore this warning the guy has because he has a great record of success — today’s candles (candlesticks) might make the market technically vulnerable so have a hedge on and make sure you have a reason for anything you have on either long or short. That is always good advice, but at critical levels in the market it is key.
Source: Twitter @RedDogT3
Apple Fight: Store Closures, WWDC, Anti-Intel and iPhone 12
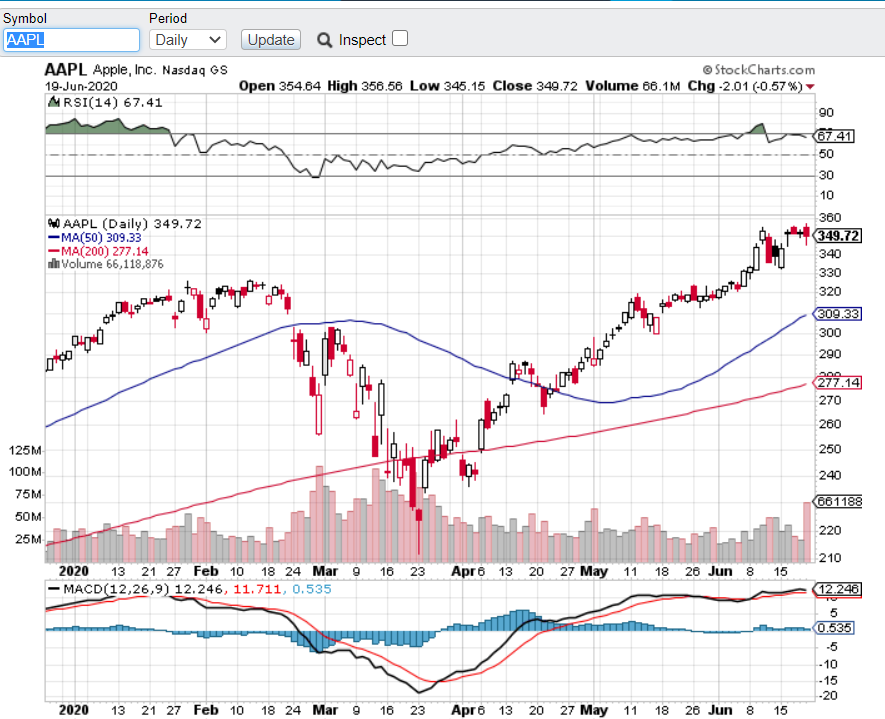
Apple Inc. (NASDAQ: AAPL) has been the comeback kid more times than anyone can reasonably count. As the shares rise, analysts chase it with higher and loftier price targets. As the shares correct, the analysts lower their targets and get cautious just in time for the stock reverse and rip higher. The stock hit an all-time above $350 recently, but there is starting to be some serious resistance there with 5 different trading days in the last two weeks failing to hold. With more than a 50% rally since March’s panic selling lows that may not be surprising along with its $1.5 trillion market cap.
Apple announced selective re-closures of stores due to local COVID-19 spikes and that signals it will not hesitate to close more stores if Cook & Co. deem it appropriate. Apple also has its WWDC this coming week and that means the expected roll-out and preview of the upcoming 5G iPhone 12 in time for the holiday season this year (that is the hope anyhow). Oh, and Apple is expected to go anti-Intel chipsets after 2020 in favor of its own. The moral of the story in Apple is that chasing it can be painful for a while, but any serious pullbacks have proven over and over that when everyone is negative the best trade was always to “hold your nose, click the “Buy” button on the screen, and not to look at it for a month or two.
Source: StockCharts.com ‘AAPL’
[wallst_email_signup]
Additional charts and explanations continue on Page 2 and Page 3.
Kraft-Heinz Finally Stops Kicking Warren Buffett
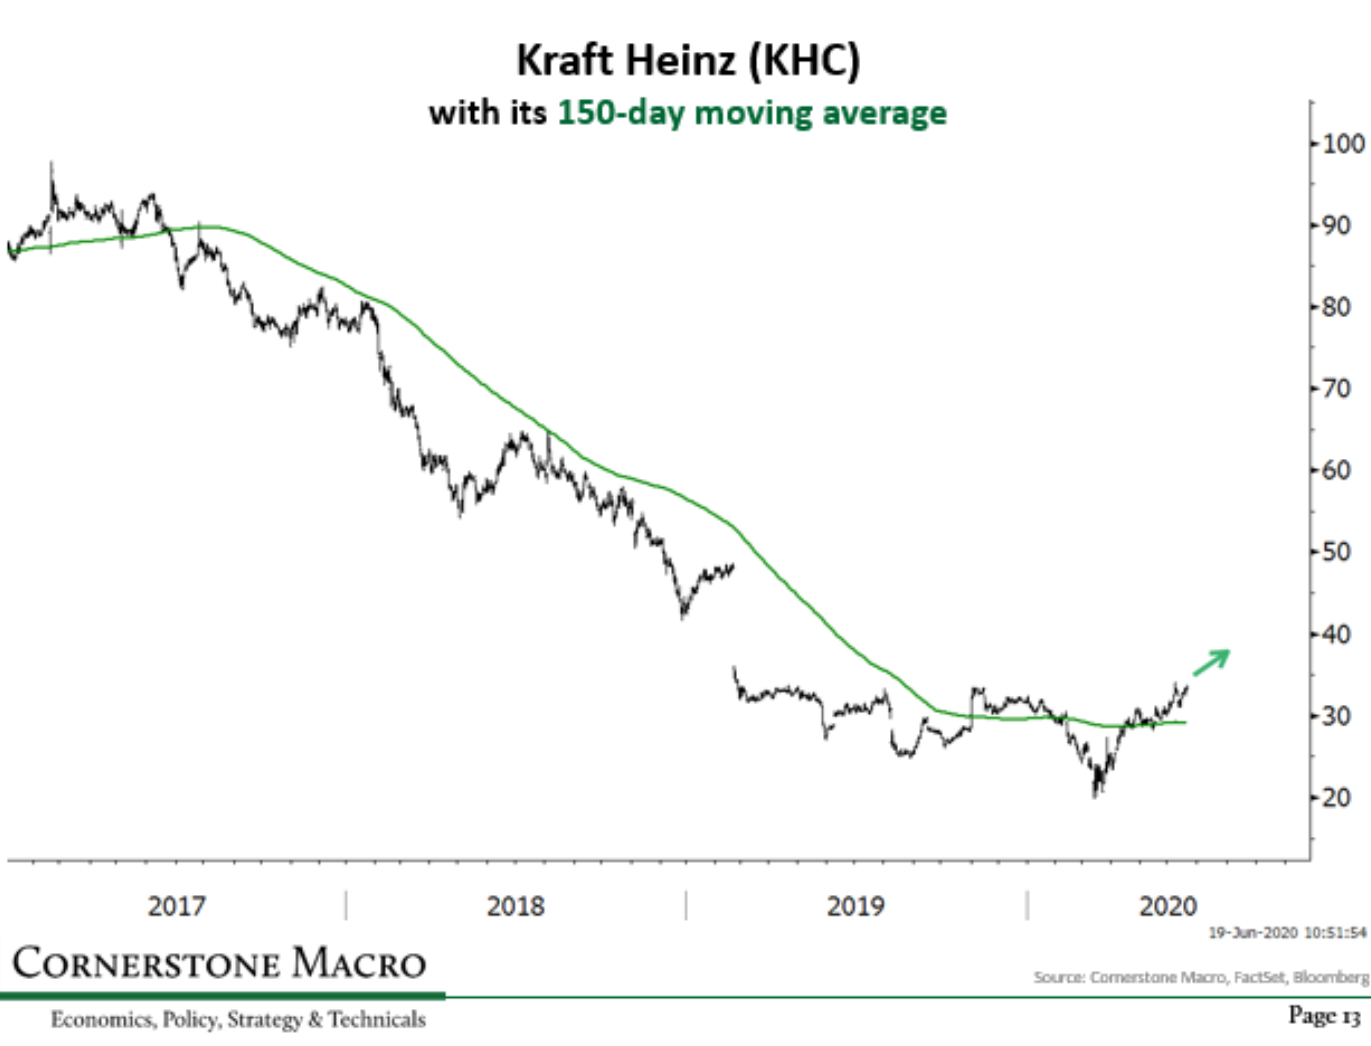
Is The Kraft-Heinz Company (NASDAQ: KHC) ready to keep breaking out of its long slumber? Warren Buffett’s “other worst investment” might even be starting to look good here. Market technician Carter Worth highlighted this on Friday. With any market cooperation at all, Kraft-Heinz is completing the “Bearish-to-Bullish” reversal and a prospective completion of this bottoming-out process implies a move back up to the $45.00-ish (plus or minus) level.
After closing at $33.48 on Friday, the shares are up well over 65% from its $19.99 low of the last 52-weeks. That said, the 52-week high of $34.00 sounds alarming right up until the reminder that this was a $90 stock back in 2017 after 3G and Warren Buffett went deep into the company.
Source: Twitter
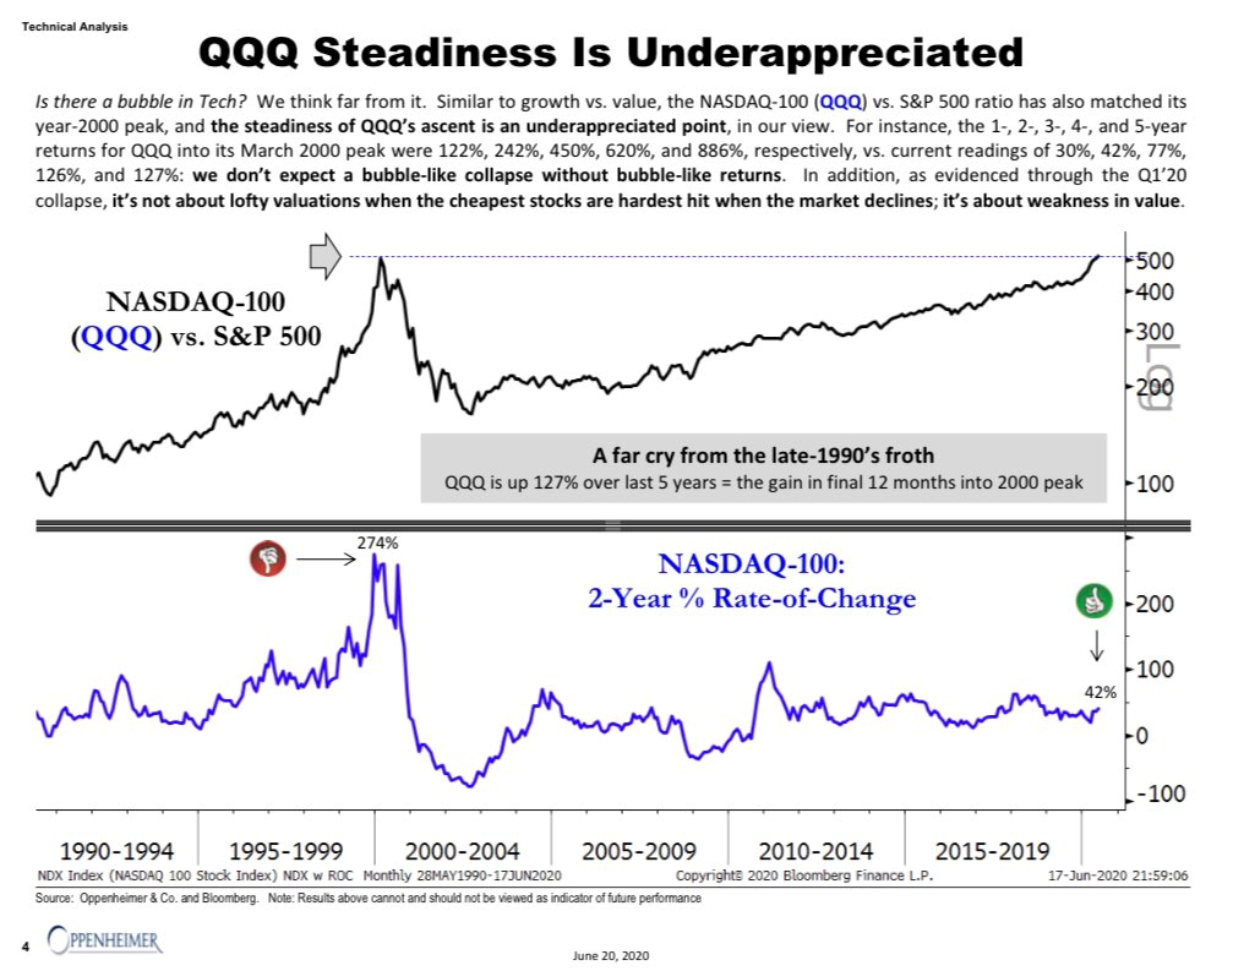
Is the New Tech Bubble in QQQ Really a Tech Bubble?
Many investors want to refer to the bubble in technology stocks today and the one aspect that may show this the best is the Invesco QQQ Trust (NASDAQ: QQQ). This chart shows the “QQQ” ETF for the NASDAQ 100 gains that have been seen. While the NASDAQ hit an all-time high despite the recession and despite the COVID-19 pandemic (or should say ‘supported by’?) the point here is that the 127% gain in the index over the last 5 years only matches the final 12 months of gains heading into the dot-com and tech bubble from 1998 heading into the year 2000.
Source: Oppenheimer chart via @allstarcharts and @AriWald on Twitter
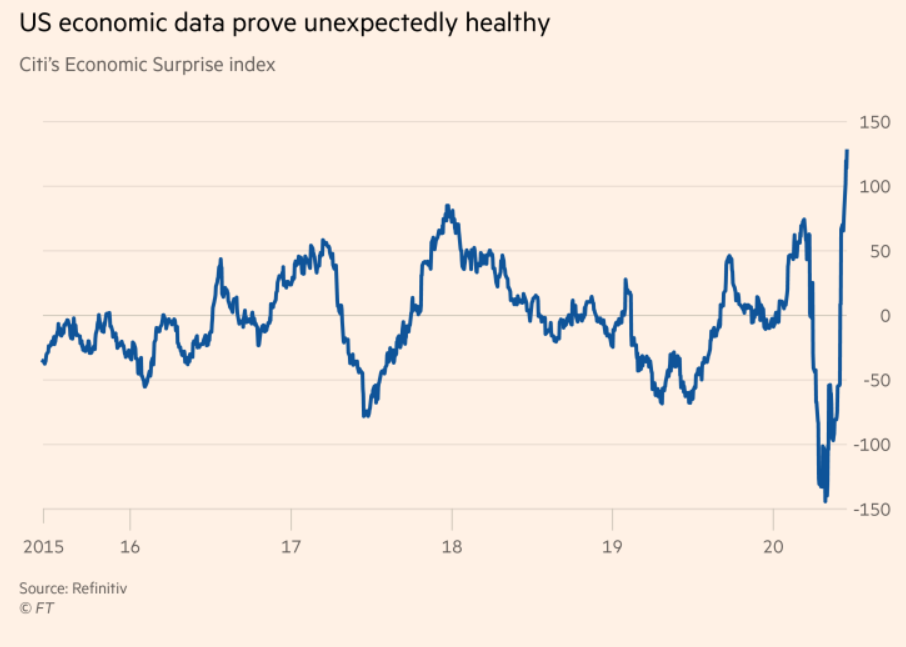
Citi’s Economic Surprise Index Surges to All-Time Highs
More economic reports are continuing to come in better than expected. The recession has been so harsh and deep that many investors, economists and businesses alike are dismissing it and looking for a rapid return to normalcy. The huge spike in COVID-19 cases is without doubt posing a threat to the stock market and the recovery. That said, Citi has its Economic Surprise Index which measures the strength of actual economic reports versus estimates. Would it be a surprise that this is now at an all-time high?
There maybe a counter-view here and that the social distancing and protective measures are being ignored so much to prompt this recovery that the second wave of coronavirus cases could create more harm ahead. Then again, the current vow is to not close to close down the economy again. Does this support a V-shaped, U-shaped or L-shaped recovery.
Source: Financial Times
[wallst_email_signup]
Is Urban One Sustainable? And Is a Secondary Offering Coming?
Each week we are featuring either a stock or an index that goes off the charts, with no pun intended. The move in Urban One, Inc. (NASDAQ: UONE) has become impossible to explain using economics and fundamentals. That said, both Bloomberg and Barron’s have referred to it as the focus on black Americans. This company used to be Radio One, and it has radio, TV and digital platforms targeting content for African Americans. Urban One was less than a $2.00 stock as recently as June 12, and now its shares have shot up to over $36 (with a high print above $50) and it now has a $468 million market cap.
Urban One’s sales have been over $400 million for the last 4 years but it also has $910 million in long-term debt. With trading volume having exploded from a few thousand shares a day to averaging over 20 million per day in the last week, wouldn’t this be a smart time for the company to raise cash in a secondary stock offering?
Source Finviz.com ‘UONE’

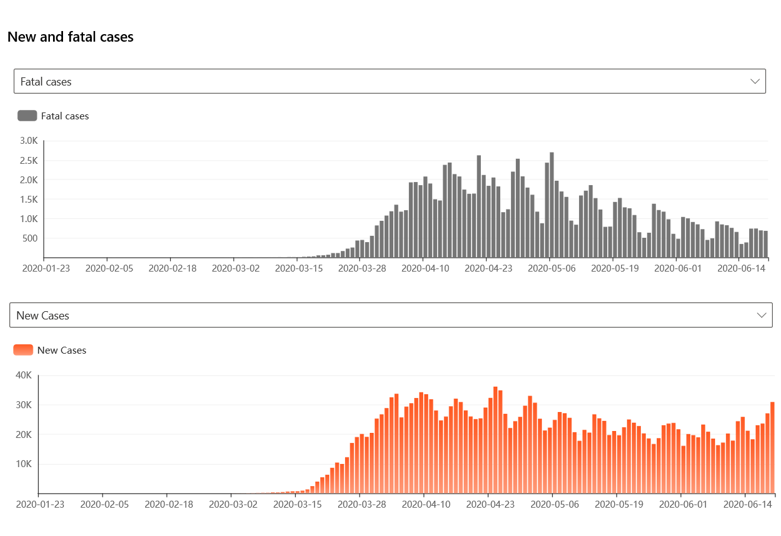
COVID-19 Charts: New Cases Spiking as Fatal Cases Are Shrinking
The economy has been reopened in phases throughout the country, and the public has three things that have happened. The stay-at-home measures seemed to have lasted forever. There has been national protests and civil unrest. And now the political rallies are starting. So far, there are not sporting events, concerts and movies have yet to reopen.
There is a serious ramp-up of COVID-19 cases in many of the states that reopened earlier than others. At the same time, the number of fatal cases of COVID-19 are lower. There were 682 fatal cases on June 19 and the fatal cases keeps getting lower. There were 30,927 new cases on Friday, June 19, and that was the highest level since May 1. The peak of new cases was 36,139 on April 24, 2020 and the highest daily fatalities were 2,701 on May 6.
It should be assumed there are some discrepancies using the number of days due to the reporting issues at local levels. There is also a lag in the time of new cases causing death as well, but the weekly data should show what the trends have been. There are of course age issues and other demographic issues that could be tallied here, but these are the raw numbers.
Source: MSN Coronavirus (COVID-19)
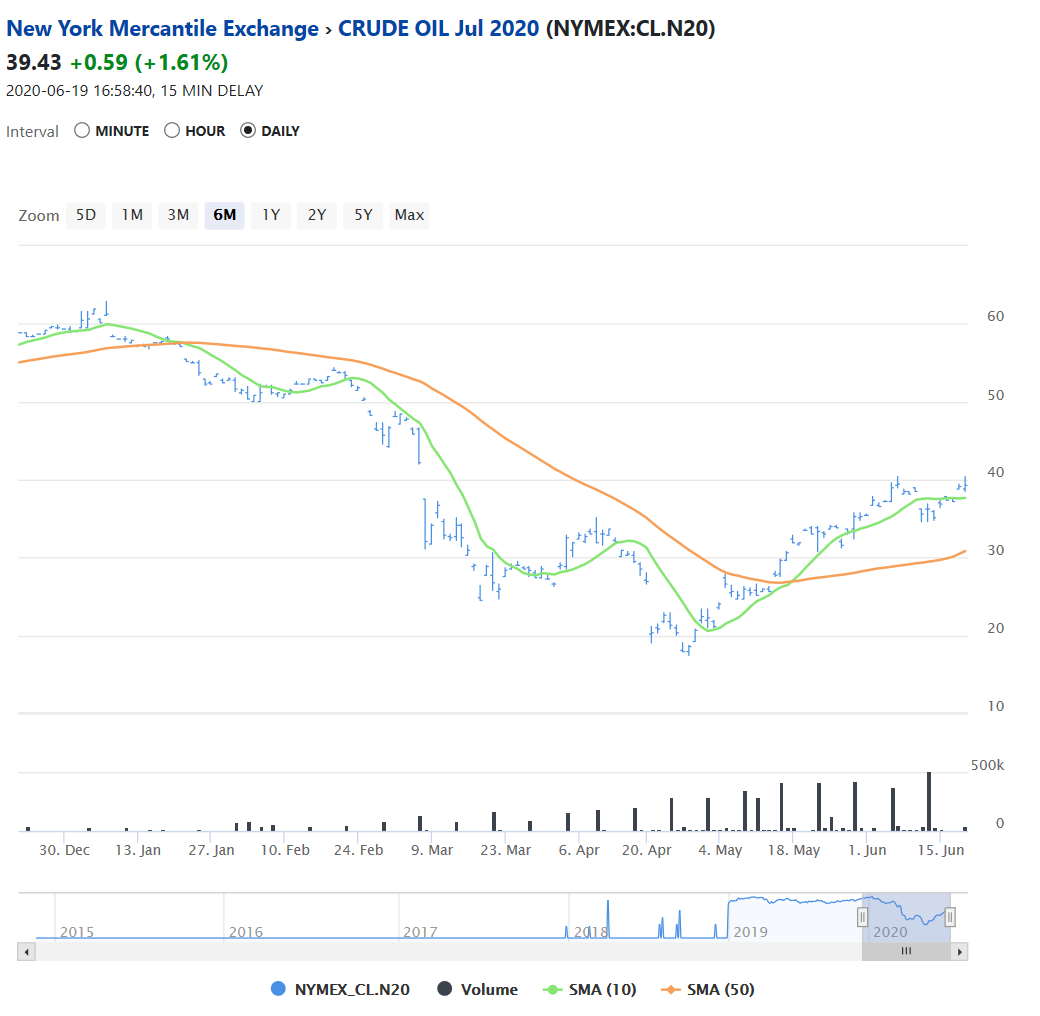
Crude Oil Back Where It All Began
The dramatic fall in crude oil price in 2020 has been ghastly. The coronavirus and economic shutdowns were the first bite, but the price and share war between Russia and Saudi Arabia did the big damage. What is odd here at this time in June is that crude oil is right back to that no man’s land of when the unprecedented fall began.
There is serious resistance up at $40 and above, but that bounce back from under $20 is what has allowed for so many strong stock moves and analyst calls for companies to keep rising ahead.
Source: INO.com
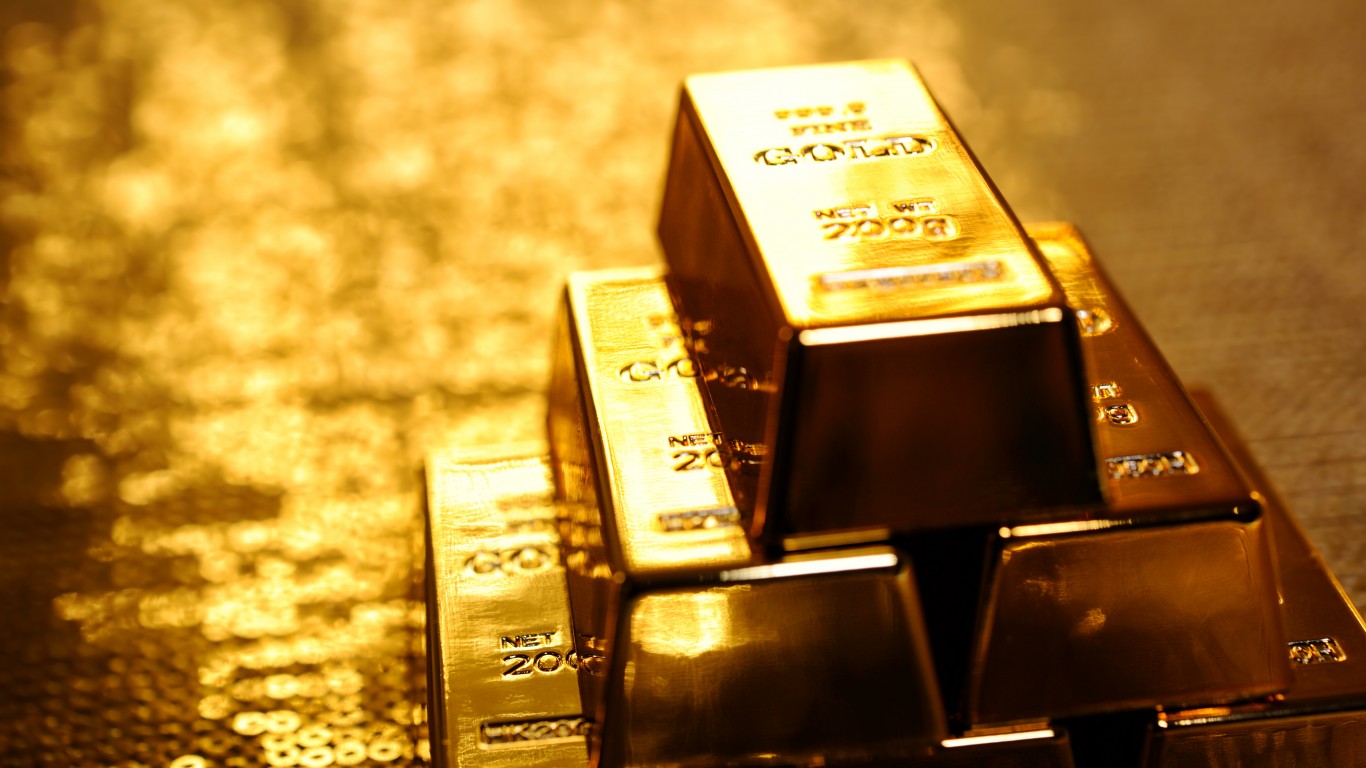
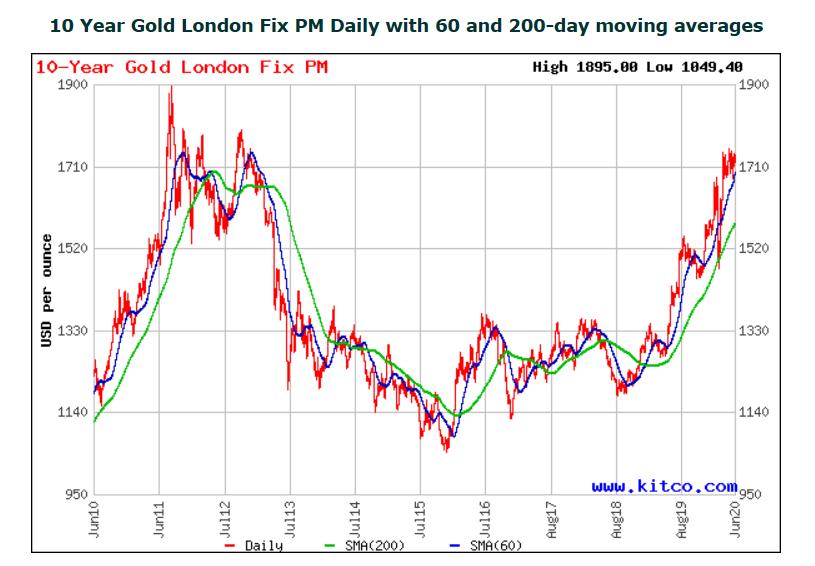
Gold’s Place at $1,750 and Above
Gold is bumping back up against $1,750 per ounce and there is a serious level of resistance on the chart. When you look at a 10-year chart, look at what happens were you get these wider periods of time where the gold chart turns into a “red magic marker” as traders fight it out. The trading history shows that explosive moves have been witnessed thereafter. Whether that next explosive move is higher or lower has yet to be determined.
With trillions of dollars in newly minted stimulus money by the Fed and trillions elsewhere from central banks it’s probably an easy bet to guess which direction the so-called gold bugs are expecting. And for the downside, if the economic recovery is going to continue and if better income and safety sources are abundant, then gold may lose some of its luster.
Chart Source: Kitco.com 10 Year Gold Chart
[wallst_email_signup]
Contact [email protected] for any questions or corrections.