
Now that June is underway, the recent recovery in unemployment and the continued surge in the stock market have managed to surprise just about everyone. These are also hard to fathom in the wake of civil unrest that has been dominating the news in recent days.
Employers, investors, economists and those who are looking at financial opportunities must consider what the action in the markets, the economy and in current events are actually suggesting about the coming days, weeks and months. The stock market and other markets are trying to discount the current trends of weak economic data, weak earnings, and even the civil unrest that is present today. In fact, the stock market is generally anticipated to be a live money voting instrument for where the economy will be in six months or so.
Sometimes the best way to get a message out is visually in charts and graphs. 24/7 Wall St. has created a weekly review of some of the best charts, tables, graphics and other images that should be given deep consideration for the coming days and further out based on what is happening now and what is expected to occur ahead. Anyone who has their assets in stocks or bonds better have an understanding of what the markets are trying to tell them.
For the week ending June 6, 2020, there is a lot at stake for the summer and later in the year as the election cycle will go into overdrive. The Dow closed up 829 points at 27,110.98 and the S&P 500 closed up 81.58 at 3,193.93. The NASDAQ has even managed to hit a new high of 9.845.69. Meanwhile in rising yields, the 10-year Treasury note looks ready to challenge 1% and the 30-year Treasury long bond may be ready to challenge 1.75% again.
We have first covered the S&P 500 more than once, as well as The Boeing Company (NYSE: BA | BA Price Prediction), Hertz Global Holdings, Inc. (NYSE: HTZ), gold, Treasuries, oil, bonds, and bitcoin. A special note has been provided around the COVID-19 impact on the market and a tropical storm that is likely to be a U.S. issue in very short order.
[nativounit]
A brief commentary has been provided on each chart and graphic, as has the source of each item featured. While these have all been numbered, there is no intended ranking of importance of each chart or graphic as that importance will depend upon each reader’s interests. Here are the 10 top charts we are seeing heading into the week of June 8 to June 12, 2020.
1. No More Bear Market: Can the S&P 500 Actually Turn Positive for 2020?
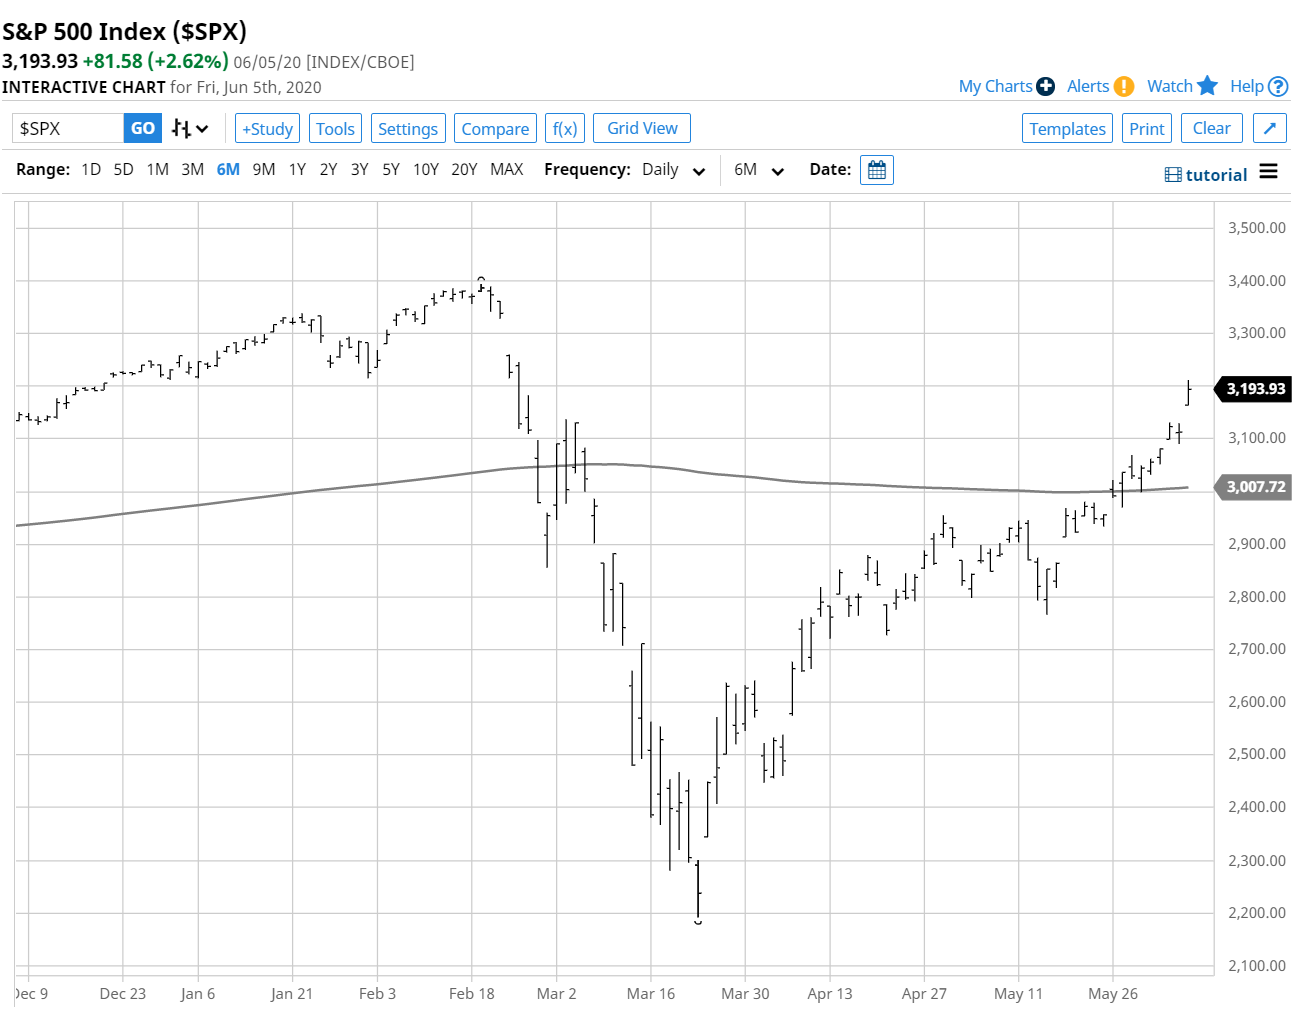
The S&P 500 has magically, miraculously and almost unbelievably recaptured most of its losses. In fact, after hitting 3,200 late on Friday the S&P 500 was down just 5.7% from its all-time high in February and was somehow down only 1% year-to-date.
This almost doesn’t even seem possible considering how almost every business is still worse off than it was before that isolated coronavirus news in China turned into a global pandemic and an instant recession. Oh well, you can scratch your head, think about it, and then overthink it. It’s almost assured that the stock market doesn’t care what you, me, or any other individual thinks. And if the thought of “it just can’t keep going” comes to mind, never forget this mantra — the market can remain irrational for far longer than you can remain solvent with conviction about a position.
Please look closely at the chart here. After the S&P 500 experienced its first day of panic (2/24), it went just under 3,215 and closed at 3,226 on a rounded basis. Those levels had also acted as a support in January three different times before continuing its run higher in February. Like it or not, do not think that those slightly higher prices are not significant levels even if we have blown back above the 200-day simple moving average. Want more proof: the S&P hit a high of 3,211.72 on Friday.
Source: Barchart.com (S&P 500 Index)
[wallst_email_signup]
More charts with summaries on the S&P 500, Boeing, Hertz, bonds, oil, gold and bitcoin are shown in detail on the remaining pages.
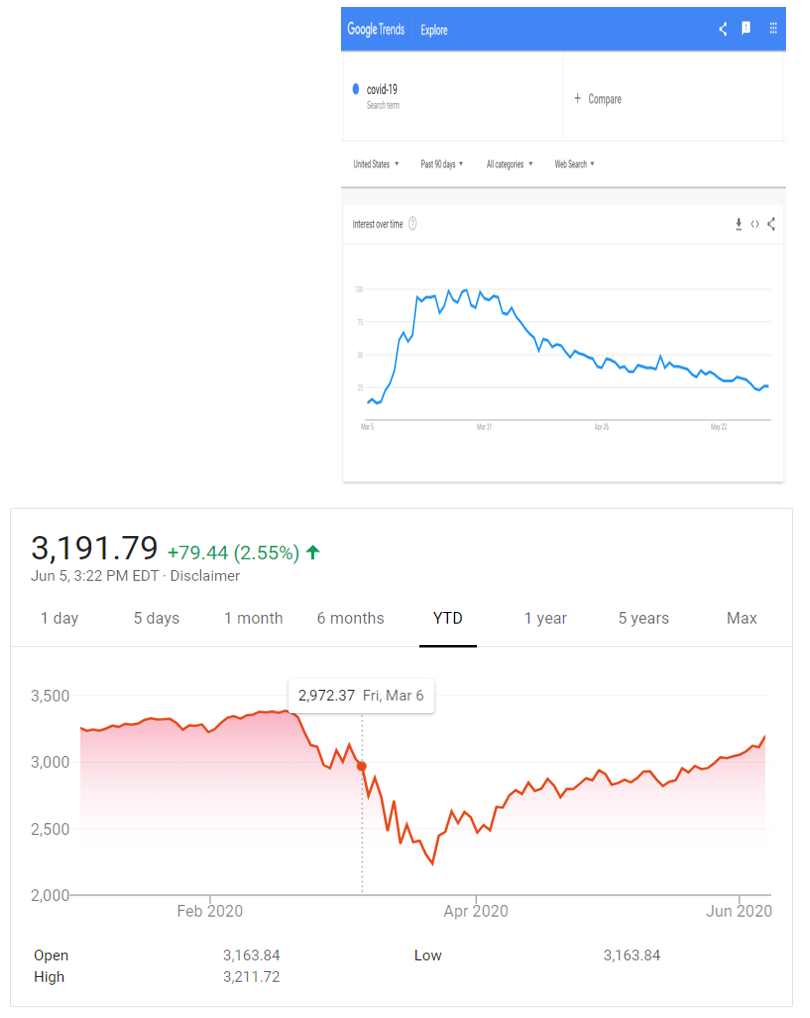
2. Google Trends on COVID-19 Search vs. Stock Market Rally – Nailed It!
Alphabet Inc. (NASDAQ: GOOGL) may truly know everything about you because of its Google. Perhaps it knows everything about the stock market too, whether the company knows it or not. Using search terms to determine market tops and bottoms or major moves may seem silly. And in many cases it would be. That said, look at how closely a Google Trends nailed it as the peak “COVID-19” search term in trends with a 90-day look-back compared to Google’s chart of the S&P 500. That said, many places have rising COVID-19 cases being reported currently. We chose to compress the Trends chart and keep the S&P 500 chart extended to create direct time overlays and since a 90-day look-back would have missed the first to weeks of selling at the start of 2020.
Source: Google Trends; Google Finance
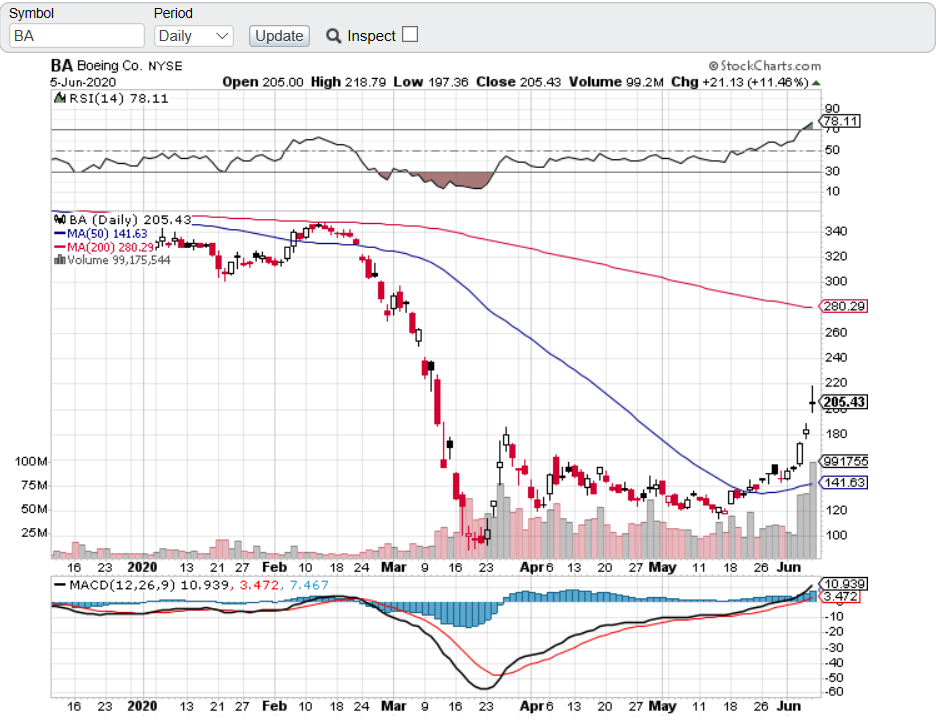
3. Boeing Flies Out Of Purgatory, Next Stop…
The Boeing Company (NYSE: BA) was on a fantastic flight higher and higher up until its dual 737 MAX crashes in early 2019. The recertification process has taken more than a year without much fanfare until recently when reports were made that Boeing was rekindling the 737 MAX manufacturing. Another report suggested the plane could be recertified soon, but layoffs could plague it. The aspect that wiped Boeing out in 2020 was that it went from massive plane demand from the financially healthiest airline customers ever to a bunch of customers who had to be bailed out by the U.S. government here and others getting their own bailouts around the globe. But in the “risk-on” and “back to normalcy” theme of reopening the economy with travel again, Boeing’s stock has more than doubled since going to under $100 at the peak of panic selling in March.
Moves like this are not normal, but this is not a normal time. You will have to decide yourself where this stock goes from here. Look at how much higher the 200-day moving average is, and how much lower the 50-day moving average is.
Source: ‘BA’ StockCharts.com
[wallst_email_signup]
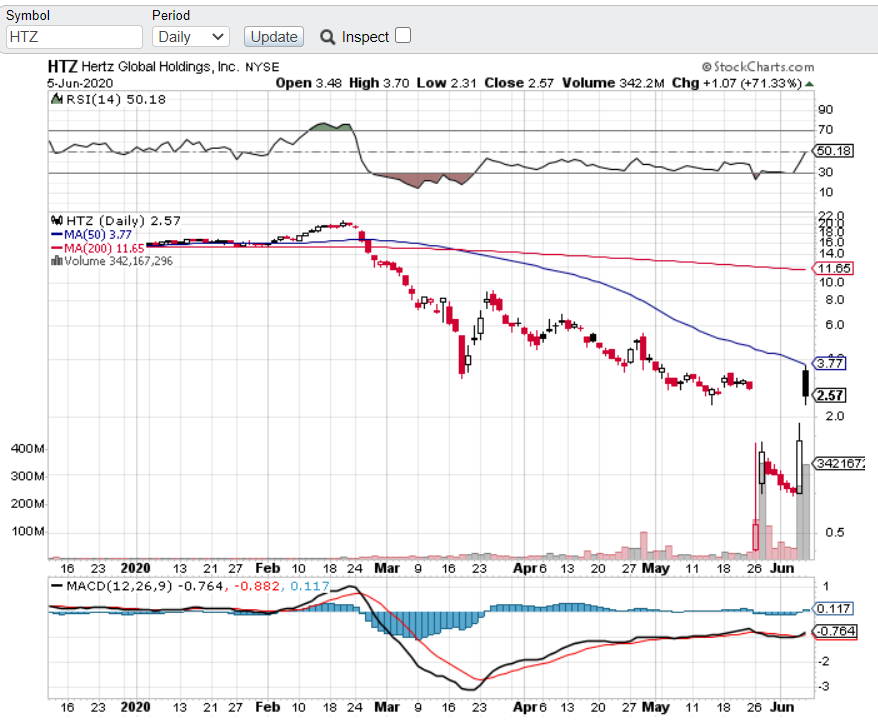
4. Hertz Just Hurts to Watch
As of about 2 weeks ago, Hertz Global Holdings, Inc. (NYSE: HTZ) was sentenced to a corporate death we know as bankruptcy. The stock would ultimately be delisted, get an OTC stock ticker (probably ‘HURTS’ would be a good guess), and its stock was assumed to be going to zero. Is that really the case? The actual Chapter 11 voluntary bankruptcy press release from May talked about having $1 billion of cash on hand to support its continuing operations, but while it warned of delisting it did not specify the usual “common shareholders are likely to be left little to no value.” And Carl Icahn has unloaded his entire stake at a severe loss after the filing.
Hertz rallied strongly on Thursday, but Friday’s strong unemployment report and a note about better airline travel kindled a 100%-plus rally initially that turned into a 71% gain at the close. Even at $2.57 the stock is back up close to the pre-bankruptcy level even if way down from its highs. Maybe there is someone new ready to come in, or maybe investors were spending time in the newly opened Hopium Den across the street from the NYSE. We should (or hope to) know more soon, but this was a head-scratcher for sure.
Source: ‘HTZ’ StockCharts.com
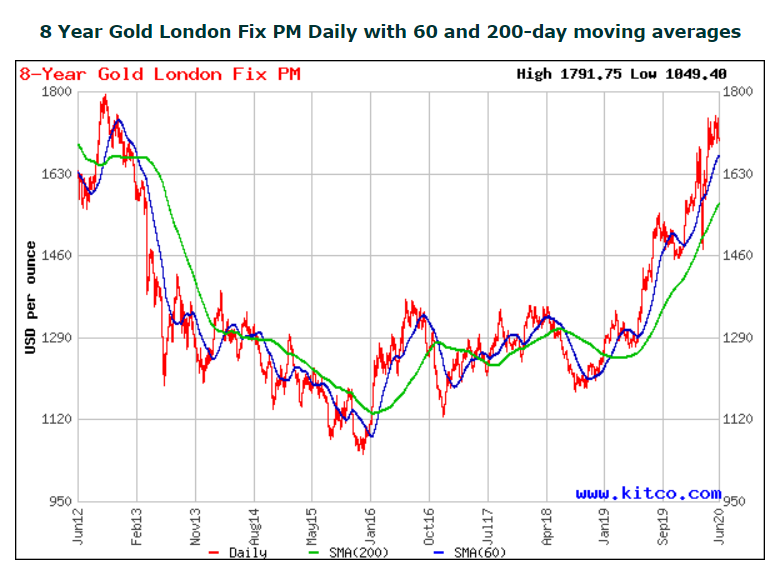
5. Goldbugs Squashed
Despite a week of protests turning into riots, looting and violence in America, it was actually a somewhat calm week internationally. And a major boom of a jobs number on Friday sent and already recovering stock market just that much higher. The yield on long-term Treasuries also shot up, and if the economy really is strong enough for the Federal Reserve to think about “normalizing” interest rates and need less stimulus than what has been seen then gold could also “normalize.” Last weekend we showed how the chart has major resistance at the old triple-top at $1,800. Well, the chart this time has failed to break out above $1,750 on 4 occasions in the last 60 days or so. This is an 8-year chart that shows the last of those triple-top trades at $1,800 and still shows the $1,750 top here. It’s impossible to say that gold is totally out of favor now, but that is some technical damage seeing this many failures and Friday afternoon’s gold prices down about $30 and close to $1,680 late in the day. Without a recovery, it won’t be long before central banks overtake ETFs owning gold again.
Source: Kitco.com
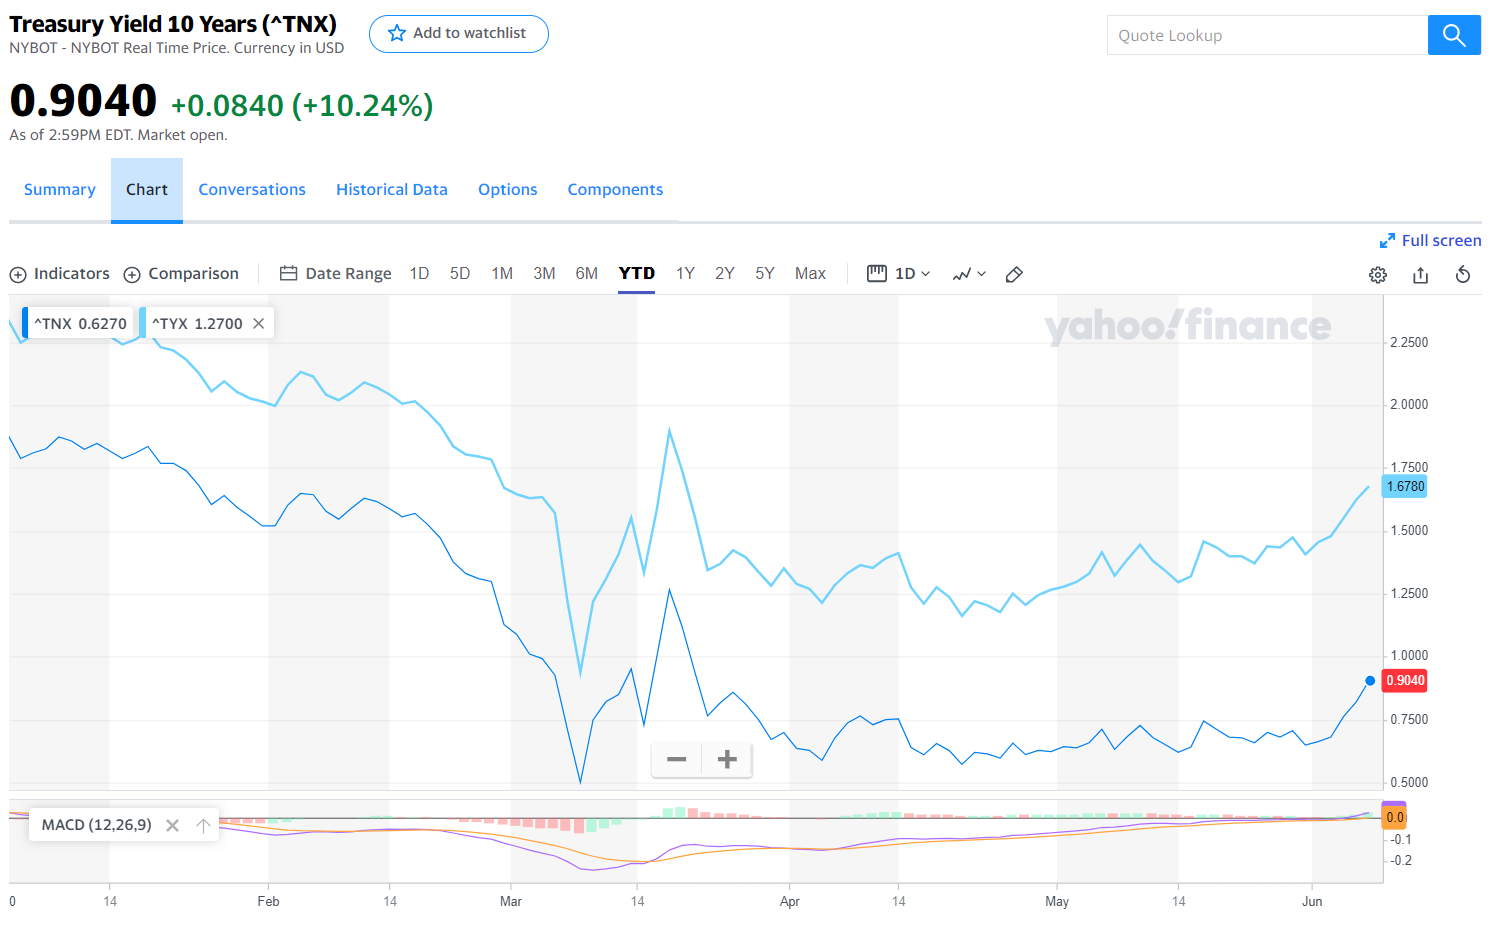
6. Long-Term Treasury Yields Surged to Post-March Highs
Unemployment and the jobs market has been a lagging economic indicator in history, but the 2020 recession happened so fast that the damage in the employment reports did not really manifest as fast as the shutdowns and the market drop looked. So what are investors and economists supposed to make of a very positive surprise in total nonfarm payrolls and lower unemployment rate in May? There were tabulation errors, there was the PPP loans that kicked in after first-round recipients received their funding. And there were other programs. Still, the long and short is that long-term Treasury yields shot higher after having already started to rise. This could be a head-fake, but the 30-year Treasury yield was close to 1.68% on Friday and close to 0.905% on Friday. Those are hardly quite “high” yields to worry about, but trends have to start somewhere and the rates weren’t going lower without negative short-term rates in the U.S..
Source: Yahoo!Finance
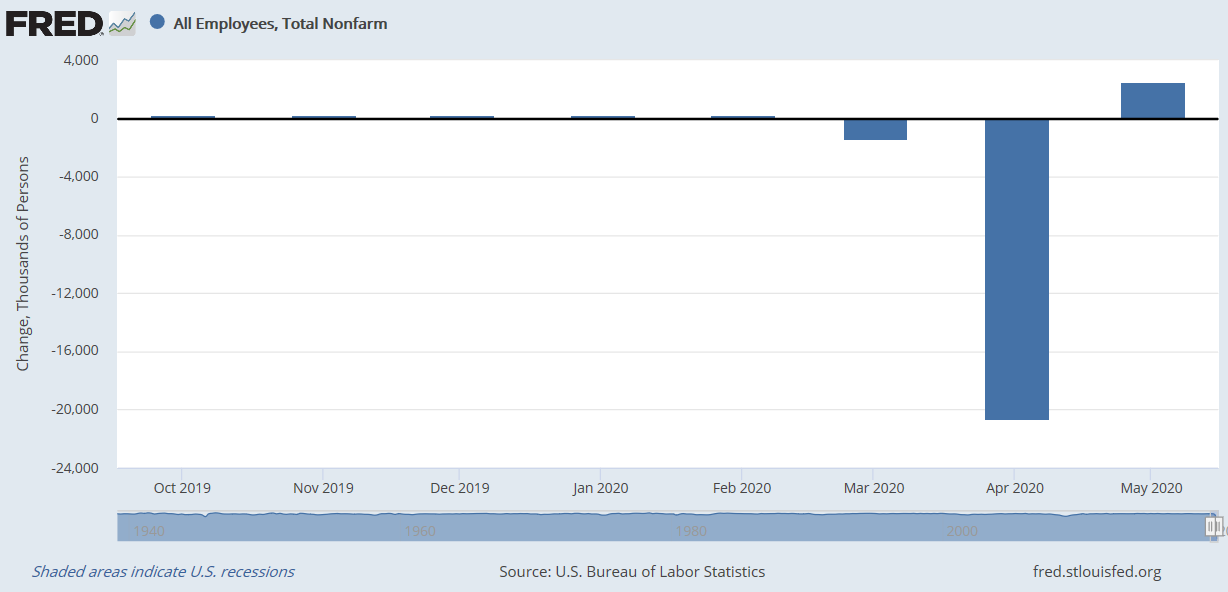
7. Nonfarm Payrolls Somehow Way Positive, Pretty Image
It would be easy to question how and why the nonfarm payrolls and unemployment rates were so far off their targets. The market was braced for another 7.5 million or so in lost payrolls in May. We saw a gain of 2.5 million instead, and on the surface it could pose a risk to future stimulus. Several issues came into play. The BLS admitted that there were some miscalculations on its drop in unemployment that “helped it by 3%” but there are two other issues impossible to calculate. The first wave of the Paycheck Protection Program (PPP) had been fully sent out by the start of May, so business were adding people back. The other issue was that the reopening of the economy began to get back into swing.
Source: St. Louis Federal Reserve (FRED)
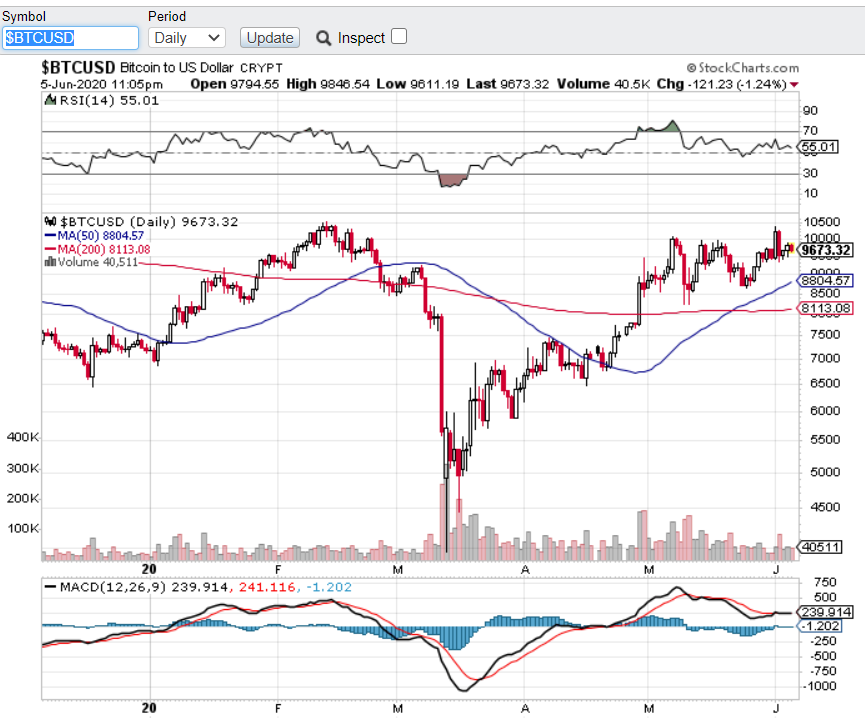
8. Is This a Bitcoin’s Hanging Man Chart?
Is Bitcoin facing another hanging man chart pattern? Even if it isn’t, its chart has been acting toppy. If there is no rush for digital gold, and if the employment report’s major surprise in strength is any barometer then what does it mean for bitcoin if the U.S. won’t need more stimulus? And that last point is not even known yet. With the price of bitcoin trying to go over and stay over $10,000 in recent days, it did not help that the Coinbase website crashed. And now there is a fight between Bloomberg predicting a $20,000 price days after Goldman Sachs issued 5 key reasons why bitcoin is not a suitable investment and not an asset class. By the way, there are now almost 18.4 million bitcoins that have been mined out of the maximum 21 million that can be allowed. Is a U.S.-listed Chinese bitcoin-related IPO feasible? Doesn’t it make you wonder what Nouriel Roubini has to say about it?
Source: StockCharts.com
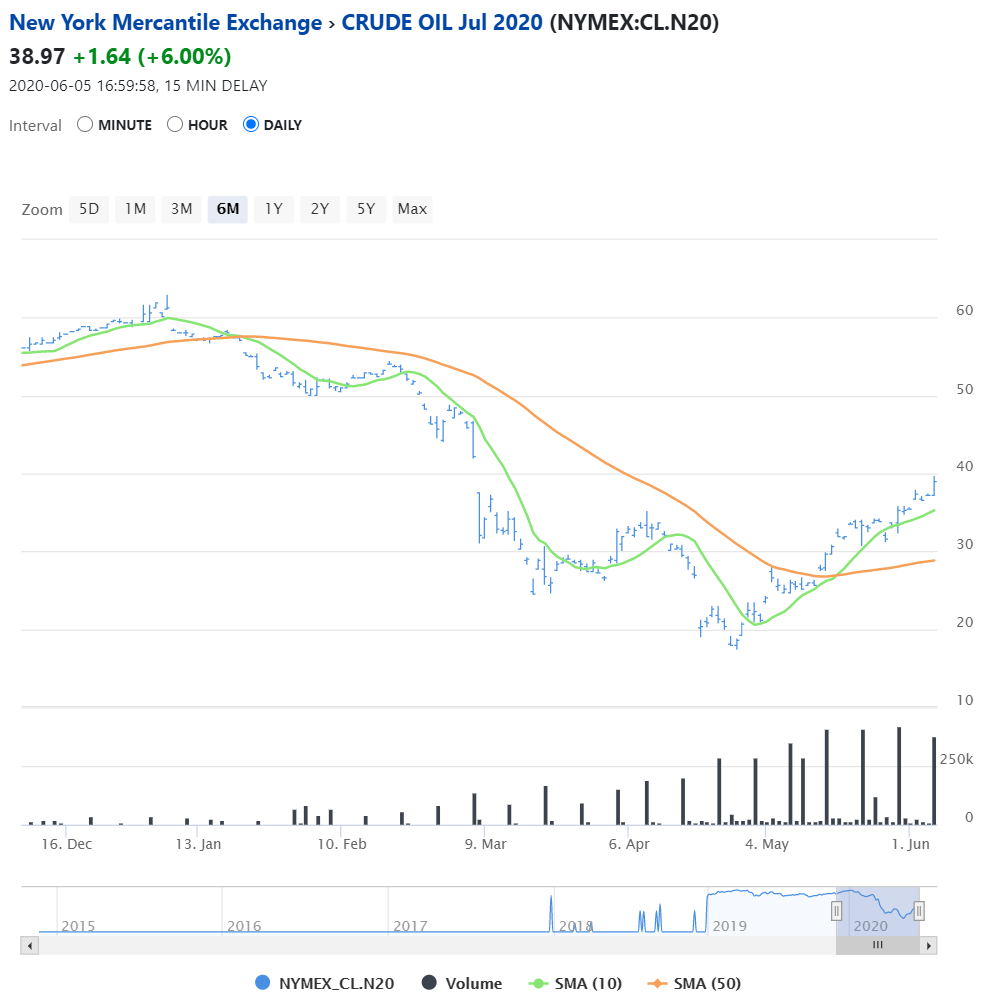
9. To the Victor… Go the Oils?
Oil surged on Friday’s great jobs report, but now there is a question of how good something can be when things are still quite weak. It was barely a month ago that the market was facing a nearly unexplainable issue about negative oil prices ahead of a futures roll and expiration issue. With oil’s unprecedented drop to under $20 in April, now all of a sudden the price is nearing $39.00 and $40.00 per barrel. That’s great news for the oil stocks and assures that perhaps there may be more than just 10 oil/gas survivors in 2030, but now the oil chart is fighting to potentially retest the levels back before the Russia/Saudi price and market share war kicked off.
Literally any buyer of oil since March has come out way ahead now, but that means there are many potential sellers with big profits at the same exact levels where there should be big resistance each dollar (or less) above the current prices. The U.S. oil rigs keep dropping as more and more people return to driving after being under house arrest.
Source: INO.com Crude Oil
10. The First Actual Storm of 2020 Likely to Hit the USA: Cristobal
This graphic from the National Hurricane Center shows Tropical Storm Cristobal as the first storm of 2020 projected to make a direct hit on the Gulf Coast of the United States. It is projected to remain a tropical storm with wind speeds of 39 to 73 miles per hour. As of 7:00 pm Friday evening the maximum sustained speeds were 40 miles per hour, but we all know these can increase or decrease in a short period of time.
Source NHC/NOAA

[wallst_email_signup]
Contact [email protected] for any questions or corrections.