

 The sell-off in China is potentially far more important than the issue surrounding Greece’s in-or-out status. By our take it is more important, but the broader financial media still wants to spend more time talking about Greece. This massive sell-off in Chinese stocks might not be a surprise to many outsiders who did not get caught up in the hype from mid-2014 to about a month ago. China is doing what it can to stop the bloodletting, but reviews of the Shanghai chart and the Nasdaq tech bubble charts might make some investors fear a much deeper market correction in China.
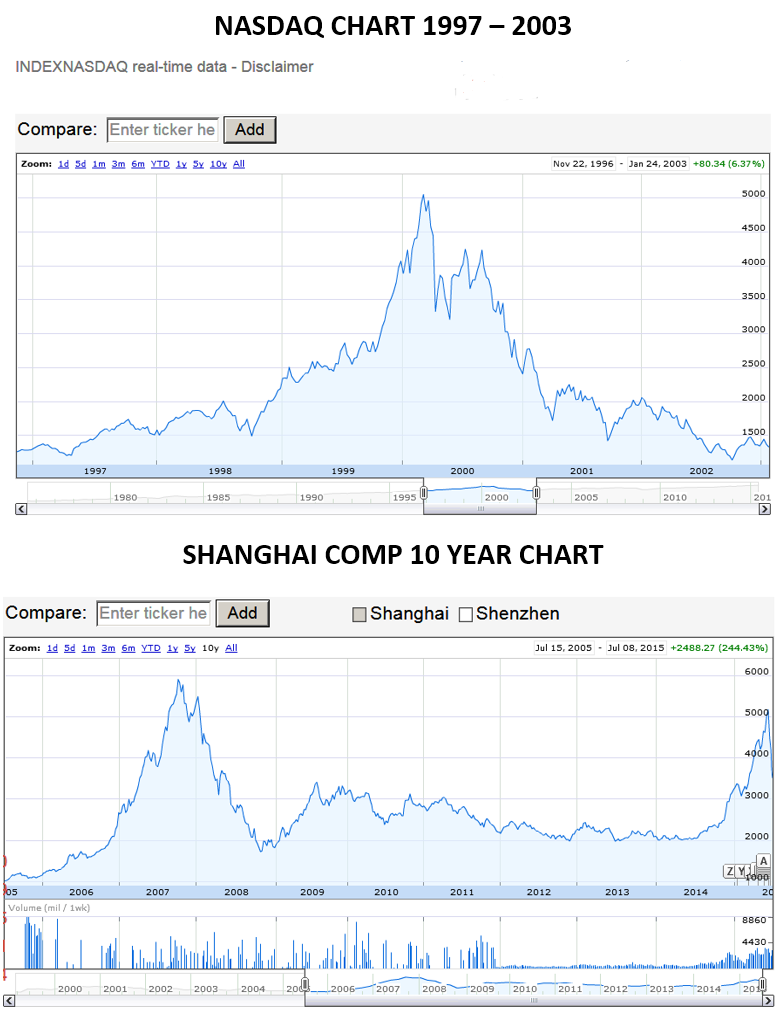
What investors need to consider at this time is just how bad things might actually get. No one has a crystal ball, but there are two great previous lessons that can be used here. One is the massive run higher in Shanghai before the global recession in 2008, and the second is the Nasdaq bubble that was seen in the United States from 1998 into 2000. The question to ask is whether this time will be different. The Nasdaq tech bubble was truly a defiance of logic on valuations. The last run was the peak of the boom time before the credit bubble sent the world into recession.
24/7 Wall St. pulled some customized charts from Google Finance that show the lead up to the 1998 to 2000 Nasdaq tech bubble. We then ran a longer chart on the Shanghai chart, which turns out that the real comparison should be in the past 10 years. We have also reviewed trading action of late in exchange traded funds, funds and shares as follows: iShares China Large-Cap ETF (NYSEMKT: FXI), iShares MSCI Emerging Markets ETF (NYSEMKT: EEM), Baidu Inc. (NASDAQ: BIDU), Templeton Dragon Fund Inc. (NYSE: TDF) and CNOOC Ltd. (NYSE: CEO).
As is shown on the Shanghai Composite chart at the end of this report, the run from 2006 to late 2007 (which coincides with a U.S. rally) went from under 1,500 up to almost 6,000. Shanghai’s sell-off was during much of the U.S. and global credit malaise, and shares gave back almost all of their gains. Still, unlike the United States, the Shanghai composite just did not hold its recovery.
Now, let’s look at the last rally and crush-depth correction in Shanghai that took place from last year until the past month. The Shanghai Composite was stuck close to 2,000 for some time until 2014, then rocketed up to 5,000 in June of 2015. Is it possible to predict that the Shanghai Composite could go back down to 2,000? Anyone can predict anything of course, but what are the real chances of that happening?
Pure market technicians say they do not care about news, P/E ratios, a Grexit or whether China slows to 4% GDP growth. This certainly doesn’t feel or look like a 2007 to 2008 scenario, but the valuation rise and market rise that was seen did feel a lot like the Nasdaq tech bubble on a grander scale. It also seems uncanny about how much the Shanghai Composite run tracked the Nasdaq run with the same 2,000 to 5,000 price handles.
If the Shanghai Composite does not hold up, then support levels are going to be hard to find anywhere close to the current levels. With the Shanghai Composite closing at roughly 3,500, it is down 1,500 points from its peak in June, for a trading loss of about 30% in a month.
The Nasdaq Composite Index took it on the chin after the 1998 to 2000 tech bubble. The old peak of 5,022 was on March 27, 2000. The Nasdaq went under 4,000 again briefly on April 4, 2000, and it was down at 3,500 by April 14, 2000. Does that sound like the Shanghai scenario?
Now what has to be considered is how long it took to get even lower. The Nasdaq hit a low of 3,042 for a loss of 40% on May 24, 2000, only to rally back to 4,000 by July 7, 2000. Unfortunately, then came a recession and the Nasdaq was down under 2,000 by March of 2001 — and the Nasdaq did not hit its all-time high above 5,000 again until 2015.
There are still some differences to consider here. First off, China allowed its market to bubble up way too high this time — and much was based on pure speculation, with cab drivers, student investment clubs and the public all getting in ahead of emerging market inclusions in A shares and the like. Valuations spiraled, and then China has allowed stock halts in close to half of the stocks, and they have prevented insiders owning more than 5% from selling shares for six months.
What if China begins banning short sales or pledges to punish short sales? This is not normal behavior, but China is not a normal market either. Here is how the key ETFs, funds and some equities covering China have performed.
iShares China Large-Cap ETF (NYSEMKT: FXI) was down nearly 7% at $39.08 on Wednesday. This ETF had moved about 70 million on the day so far, within a 52-week trading range of $36.72 to $52.85. Within the past month, FXI was trading nearly as high as $50 but it dropped off significantly. This is the main ETF of China.
iShares MSCI Emerging Markets ETF (NYSEMKT: EEM) was down 3.4% at $36.81, on a 52-week trading range of $36.72 to $45.85. The ETF hit a new 52-week low late on Wednesday after falling 10.4% over the course of the past month. EEM moved over 74 million on the day so far. This ETF says “emerging markets” but it is heavily dominated by Chinese stocks already.
ALSO READ: Cyberattack on US Power Grid Could Cost $1 Trillion
Baidu Inc. (NASDAQ: BIDU) shares were last seen down 1.5% to $184.70, in a 52-week trading range of $176.69 to $251.99. Over 5.7 million shares had been traded on the day thus far. Within the past month, Baidu shares were trading above $210 but have since fallen 12% to the current price level.
Templeton Dragon Fund Inc. (NYSE: TDF) is a closed-end fund rather than an ETF. It was last seen down about 4.4% to $22.00, in a 52-week range of $21.93 to $28.25. TDF did not move too much on the day, roughly 145,000. In the past month, TDF was being traded for roughly $27, which dropped 18.5% to current prices and a new 52-week low.
CNOOC Ltd. (NYSE: CEO) shares were last seen down 6.5%, at $126.40 in a 52-week range of $124.16 to $202.33. Only 416,000 shares had moved on the day. Shares hit a new 52-week low late on Wednesday and were down 17% over the course of the past month.
iShares MSCI Frontier 100 ETF (NYSEMKT: FM) was down 1.2%, at $28.25 in a 52-week range of $27.53 to $39.32. About 184,000 shares had moved on the day. Within the past month, shares fell 7% to the current price level. China is not a frontier market all any longer, but the so-called frontier markets have been brutalized along with China.
There are several views to consider here that just came out on Wednesday:
- Fed’s Williams (Dow Jones Headlines): China Market Meltdown Not Huge Issue For US; Not Surprised China Market Seeing Correction.
- Peter Boockvar of The Lindsey Group: At 3,506, the Shanghai index is just above its 200-day moving average of 3,423. Almost 750 more were trading limit down, taking the total to 2,000 that have stopped trading as margin calls are rampant.
- HSBC raised A-Shares to Neutral from Underweight. They had lowered their rating to underweight back in in April due to the risk of high leverage and selling pressure from corporate insiders. Now HSBC sees value from the balance of margin financing, a drop in insider selling, regulatory options expanding and potential fundamental gains in the second half of 2015.
- Hank Greenberg of Starr (former AIG head) told The Wall Street Journal not to get too panicky because they weren’t all excited on the way up.
- Reuters: Chinese ADRs continue to fall; hedging demand soars.
- S&P Capital IQ downgraded the PowerShares Golden Dragon China Portfolio from Market Weight to Underweight.
- Sinopec’s 2Q15 EPS guidance is for a 10x QoQ rise, driven mainly by a downstream profit boost supported by crude oil recovery.
- Bank of America Merrill Lynch: BofAML China strategist argues that the damage from the A-share correction is likely to spread far beyond the stock market. While the world focuses on the Greece situation, China’s outlook is clearly more critical to the U.S. Machinery sector. Commodity markets are in turmoil (China is 50% of demand for most commodities). China excavators fell 34% in June (CAT -27%).
- FOMC Minutes: Real GDP growth slowed in China.
There are some last considerations here. First, this is not a prediction of the next crash, even if the Nasdaq from the year 2000 sure has a lot of similarities to Shanghai in 2015. Second, there are many moving parts that are not just around one country today. Any time you see an article talking about a crash, after a sharp 30% drop (even with past data as evidence of risk), some might wonder if that marks something closer to a bottom rather than the next crash. Also, short-term technicals are starting to indicate that a massive oversold reading is beginning to form. Whether the next move is a sizable bounce that is sustainable or it is a dead-cat bounce remains to be seen. Another issue is that Shanghai has not been correlated to other equity markets.
ALSO READ: 5 Chinese Stocks That May Now Be Value Stocks
Another note and admission has to be made, and that is that most Western investors simply do not understand China. That is a market that is manipulated and regulated by mechanisms different than many investors are used to. Lastly, many investors have no means of trusting economic reports and comments or forecasts made by company officers in China.
Below are the charts for Nasdaq before and after the tech bubble peaked in 2000, as well as the “then and now” charts for the Shanghai Composite.
Contact [email protected] for any questions or corrections.


