© Dimitrios Kambouris / Getty Images Entertainment via Getty Images
Public corporation CEO compensation has been considered excessive in the United States for decades. What these CEOs make is easy to determine, because publicly traded companies are required to disclose the information. Among the groups that have complained most loudly are those who believe CEOs make little contribution to American society. Why should a CEO make hundreds of times more than school teachers, firemen, or nurses? Yet another group which often objects is shareholders, particularly when CEOs are paid well in a year when earnings or stock prices have performed poorly.
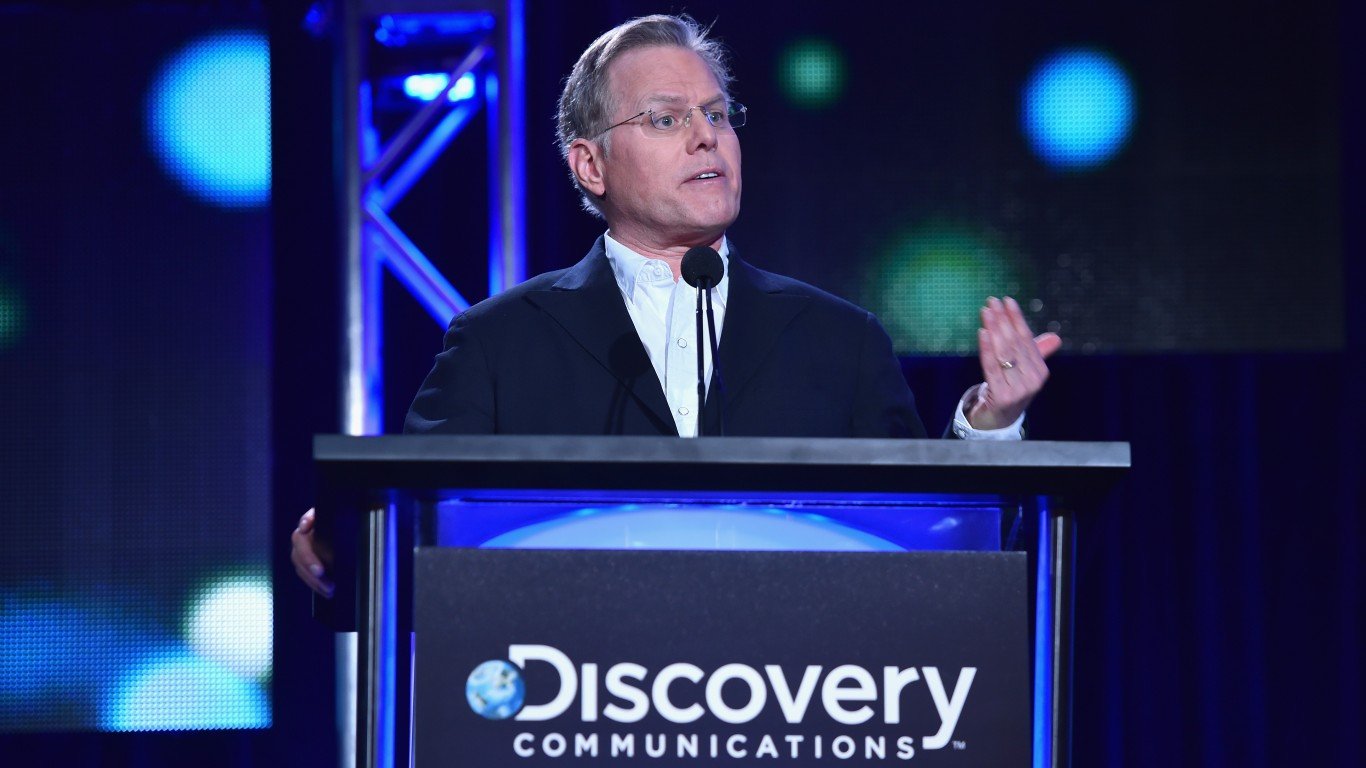
Despite these and other objections, CEO pay has risen steadily for years. Using data for the S&P 500 companies that file on a calendar year, and provided by MyLogIQ , CEO pay rose about $1 million on average in 2021 compared to the previous year. Last year the figure hit $18.5 million. These numbers include base salary, bonuses, stock compensation, and other payments companies are required to disclose to the SEC. The highest paid CEO last year was Peter Kern, who ran Expedia Group, an online shopping and travel website. His 2021 compensation was $296,247,749.
Another means by which CEO pay is measured is compared to the median compensation of each company’s employees. The rule, put into effect in 2015 by the SEC, was part of the Dodd Frank legislation. The data began to be filed in 2018. Many of these numbers have been staggering, as they were again last year. CEO to median employee pay among the S&P 500 was 317 to 1. These figures include employees both inside and outside the U.S.
The CEO to median employee ratio is often highest among companies where workers are paid very little. One example is Yum Brands, which owns KFC, Taco Bell, and Pizza Hut. Its CEO David Gibbs made $27,578, 569, which was 2,108 times more than the median pay of his workers. Starbucks is another example. CEO Kevin Johnson made $20,425,164 which is 1,579 times more than the median pay of his employees. (He was recently pushed out in favor of former CEO Howard D. Schultz. Schultz will be paid $1 a year.) Yet another example is Chipotle Mexican Grill. CEO Brian Niccol made $17,880,580, which is 1,131 times more than the median pay of his workers. The highest pay ratio was at Aptiv where CEO Kevin Clark made $14,744,780, which is 1,992 more than the company’s median employee comp.
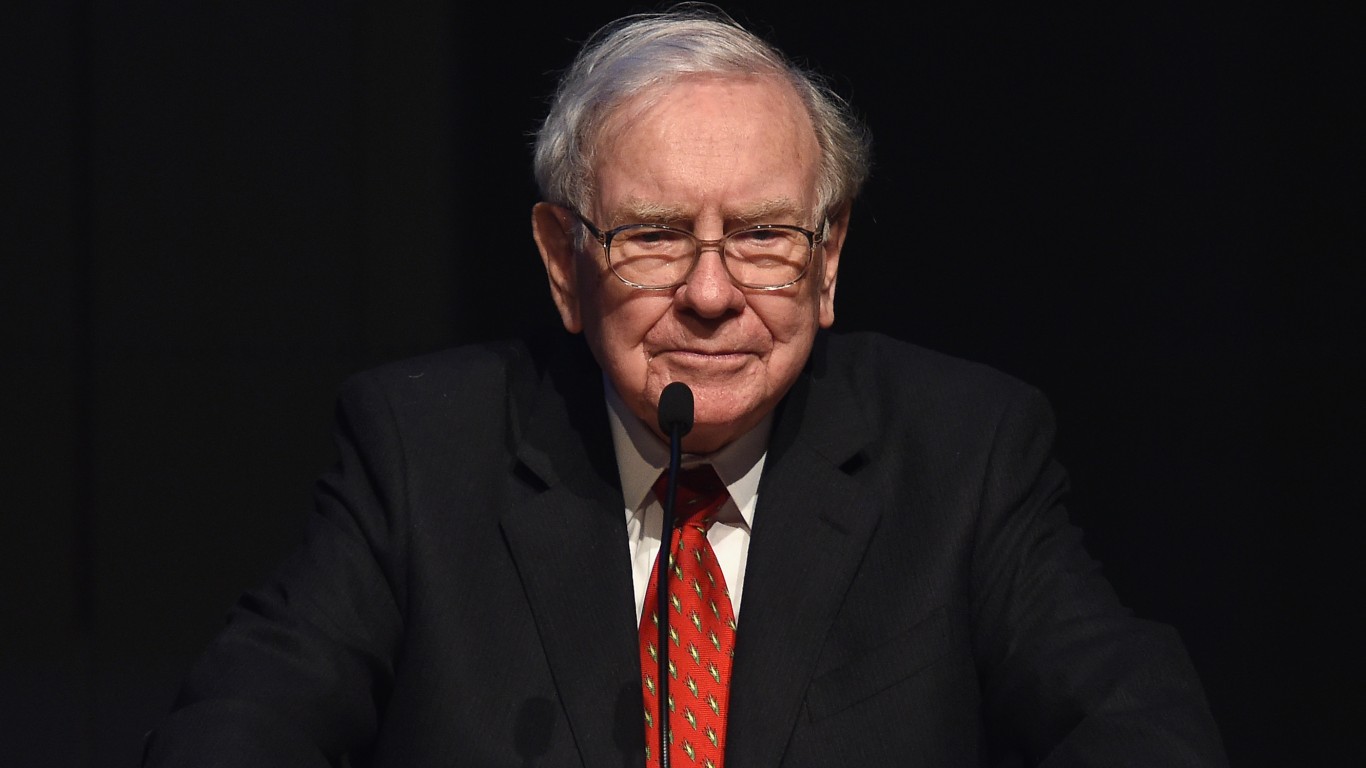
Not all CEOs make huge amounts of money. Last year, Warren Buffett, one of the longest serving CEOs in America, made only $373,204. Buffet is one of America’s richest people, with a net income of $102 billion, according to the Forbes 400. Most of this money comes from his ownership in the company he runs .
Data was provided by MyLogIQ which screens public data on corporations using artificial intelligence and machine learning. It screened 446 entries for 2021. Eight of the companies have two CEOs, so total public companies reporting were 438. Companies that close their years on the last day of December must have proxies filed by April 30. Subscriptions available from MyLogIQ to compensation analysis of all US traded companies.
Correction: A previous version of this article incorrectly listed Jonathan B. Nelson as the CEO of Omnicom Group. Nelson is the CEO of Digital. John D. Wren is the CEO of Omnicom Group. This error has been corrected.
CEO
Company
Compensation
Median employee compensation
Pay ratio
Michael F. Roman
3M Company
$18,200,584
$71,821
253:1
Robert B. Ford
Abbott Laboratories
$24,914,886
$97,952
254:1
Richard A. Gonzalez
AbbVie
$23,912,154
$149,662
160:1
Julie Sweet
Accenture
$23,085,391
$48,770
473:1
Shantanu Narayen
Adobe
$36,128,725
$165,733
218:1
Thomas R. Greco
Advance Auto Parts
$10,052,271
$24,960
403:1
Lisa T. Su
Advanced Micro Devices
$29,498,107
$128,263
230:1
Andres R. Gluski
The AES Corporation
$14,379,190
$47,543
302:1
Daniel P. Amos
Aflac
$15,728,233
$65,458
240:1
Michael R. Mcmullen
Agilent Technologies
$15,967,631
$82,890
193:1
Seifollah Seifi Ghasemi
Air Products & Chemicals
$13,819,010
$68,613
201:1
F. Thomson Leighton
Akamai Technologies
$11,951,574
$112,018
107:1
Benito Minicucci
Alaska Air Group
$5,130,162
$74,911
69:1
J. Kent Masters, Jr.
Albemarle
$9,040,753
$70,574
128:1
Peter M. Moglia
Alexandria Real Estate Equities
$8,274,131
$176,113
72:1
Stephen A. Richardson
Alexandria Real Estate Equities
$8,320,228
$176,113
72:1
Joseph M. Hogan
Align Technology
$21,591,400
$13,011
1,659:1
David D. Petratis
Allegion
$7,688,243
$65,338
118:1
John O. Larsen
Alliant Energy
$10,449,260
$110,610
94:1
Thomas J. Wilson
The Allstate Corporation
$19,066,920
$62,235
306:1
CEO
Company
Compensation
Median employee compensation
Pay ratio
Sundar Pichai
Alphabet
$6,322,599
$295,884
21:1
William F. Gifford, Jr.
Altria Group
$12,626,972
$142,614
89:1
Andrew R. Jassy
Amazon.com
$212,701,169
$32,855
6,474:1
Martin J. Lyons Jr.
Ameren
$4,305,713
$132,415
74:1
Douglas W. Parker
American Airlines Group
$7,238,011
$62,765
115:1
Nicholas K. Akins
American Electric Power Company
$15,051,215
$111,771
135:1
Stephen J. Squeri
American Express Company
$25,513,922
$67,460
378:1
Peter Zaffino
American International Group
$21,905,220
$71,936
305:1
Thomas A. Bartlett
American Tower
$16,114,574
$37,616
428:1
Walter J. Lynch
American Water Works Company
$7,398,128
$91,238
81:1
James M. Cracchiolo
Ameriprise Financial
$21,229,464
$129,010
165:1
Steven H. Collis
AmerisourceBergen
$14,873,815
$65,076
229:1
David A. Zapico
AMETEK
$12,919,431
$68,238
189:1
Robert A. Bradway
Amgen
$21,721,154
$130,589
166:1
R. Adam Norwitt
Amphenol
$13,092,697
$16,042
816:1
Vincent T. Roche
Analog Devices
$30,824,323
$46,141
668:1
Ajei S. Gopal
ANSYS
$18,260,634
$118,588
154:1
Gail K. Boudreaux
Anthem
$19,348,241
$51,005
379:1
John J. Christmann IV
APA Corporation
$15,040,707
$174,903
86:1
Tim D. Cook
Apple
$98,734,394
$68,254
1,447:1
CEO
Company
Compensation
Median employee compensation
Pay ratio
Gary E. Dickerson
Applied Materials
$35,265,559
$109,304
323:1
Kevin P. Clark
Aptiv
$14,744,780
$7,402
1,992:1
Juan R. Luciano
Archer-Daniels-Midland Company
$23,508,841
$81,320
290:1
Jayshree Ullal
Arista Networks
$15,993,632
$190,816
84:1
J Patrick Gallagher Jr.
Arthur J. Gallagher & Company
$13,882,255
$64,135
216:1
Alan B. Colberg
Assurant
$11,504,780
$44,558
258:1
John T. Stankey
AT&T, Inc.
$24,820,879
$107,570
231:1
J. Kevin Akers
Atmos Energy
$6,467,314
$78,050
83:1
William C. Rhodes III
AutoZone
$14,838,996
$30,375
488:1
Timothy J. Naughton
AvalonBay Communities
$14,371,460
$79,313
181:1
Mitchell R. Butier
Avery Dennison
$12,433,721
$15,256
815:1
Lorenzo Simonelli
Baker Hughes Company
$15,646,451
$69,701
224:1
John A. Hayes
Ball Corporation
$13,924,380
$131,452
106:1
Brian T. Moynihan
Bank of America
$23,729,169
$102,497
232:1
Thomas P. Todd Gibbons
Bank of New York Mellon
$14,128,042
$76,123
186:1
Andrew Meslow
Bath & Body Works
$17,668,627
$10,632
1,662:1
Jose E. Almeida
Baxter International
$15,634,734
$46,351
337:1
Thomas E. Polen
Becton, Dickinson and Company
$14,189,333
$38,690
367:1
W. Robert Berkley, Jr.
W.R. Berkley
$14,147,305
$102,973
138:1
Warren E. Buffett
Berkshire Hathaway
$373,204
$58,881
06:1
CEO
Company
Compensation
Median employee compensation
Pay ratio
Corie S. Barry
Best Buy Co.
$15,631,157
$29,999
521:1
Norman D. Schwartz
Bio-Rad Laboratories
$8,695,925
$78,820
110:1
Laurence D. Fink
BlackRock
$32,587,335
$164,492
198:1
David L. Calhoun
The Boeing Company
$21,093,605
$124,844
169:1
Glenn D. Fogel
Booking Holdings
$53,982,195
$58,005
931:1
Frederic B. Lissalde
BorgWarner
$17,592,090
$31,740
554:1
Owen D. Thomas
Boston Properties
$12,894,537
$123,647
104:1
Michael F. Mahoney
Boston Scientific
$16,064,039
$68,891
233:1
Giovanni Caforio
Bristol-Myers Squibb Company
$19,784,806
$148,649
133:1
Hock E. Tan
Broadcom
$60,703,627
$247,541
245:1
J. Powell Brown
Brown & Brown
$9,201,035
$91,957
100:1
Robert C. Biesterfeld Jr.
C.H. Robinson Worldwide
$10,233,276
$57,391
178:1
Anirudh Devgan
Cadence Design Systems
$21,735,794
$109,304
102:1
Thomas R. Reeg
Caesars Entertainment
$22,576,517
$35,618
634:1
Richard J. Campo
Camden Property Trust
$4,285,423
$58,767
73:1
Mark A. Clouse
Campbell Soup Company
$9,903,652
$68,586
144:1
Richard D. Fairbank
Capital One Financial
$20,457,553
$81,029
252:1
Arnold W. Donald
Carnival
$15,063,788
$8,658
1,740:1
David Gitlin
Carrier Global
$14,892,815
$66,377
224:1
Edward T. Tilly
Cboe Global Markets
$10,646,558
$165,355
64:1
CEO
Company
Compensation
Median employee compensation
Pay ratio
Robert E. Sulentic
CBRE Group
$13,908,085
$57,349
243:1
Christine A. Leahy
CDW Corporation
$8,943,903
$103,536
86:1
Lori J. Ryerkerk
Celanese
$12,570,992
$90,427
139:1
Michael F F. Neidorff
Centene
$20,637,990
$71,217
290:1
David J. Lesar
CenterPoint Energy
$37,809,810
$103,170
366:1
David D. Ossip
Ceridian HCM Holding
$10,626,701
$83,919
127:1
Leagh E. Turner
Ceridian HCM Holding
$6,470,279
$83,919
127:1
David T. Feinberg
Cerner
$20,499,056
$75,480
298:1
Anthony W. Will
CF Industries Holdings
$11,685,670
$128,415
91:1
James C. Foster
Charles River Laboratories International
$13,705,580
$51,848
264:1
Thomas M. Rutledge
Charter Communications
$41,860,263
$60,007
698:1
Michael K. Wirth
Chevron
$22,610,285
$183,531
123:1
Brian R. Niccol
Chipotle Mexican Grill
$17,880,580
$15,811
1,131:1
Evan G. Greenberg
Chubb
$23,181,184
$71,894
322:1
Matthew T. Farrell
Church & Dwight Company
$8,889,526
$73,466
121:1
David M. Cordani
Cigna
$19,872,266
$66,917
297:1
Steven J. Johnston
Cincinnati Financial
$6,490,767
$105,458
62:1
Charles H. Robbins
Cisco Systems
$25,446,695
$124,806
204:1
Jane Fraser
Citigroup
$20,541,324
$55,285
372:1
Bruce Van Saun
Citizens Financial Group
$12,430,076
$82,418
151:1
CEO
Company
Compensation
Median employee compensation
Pay ratio
Terrence A. Duffy
CME Group
$22,924,737
$153,565
150:1
Garrick J. Rochow
CMS Energy
$6,871,068
$129,141
53:1
James Quincey
The Coca-Cola Company
$24,883,878
$13,894
1,791:1
Brian Humphries
Cognizant Technology Solutions
$19,687,285
$34,225
575:1
Noel R. Wallace
Colgate-Palmolive Company
$15,458,151
$40,469
382:1
Brian L. Roberts
Comcast
$33,978,581
$83,840
405:1
Curtis C. Farmer
Comerica
$7,696,094
$102,385
75:1
Ryan M. Lance
ConocoPhillips
$23,886,640
$179,428
133:1
Timothy P. Cawley
Consolidated Edison
$10,342,198
$132,803
78:1
Joseph Dominguez
Constellation Energy
$3,352,277
N/A
N/A
Albert G. White III
The Cooper Companies
$10,994,906
$36,105
305:1
A. Jayson Adair
Copart
$490,647
$35,638
14:1
Wendell P. Weeks
Corning
$20,766,032
$40,760
509:1
Charles V. Magro
Corteva
$792,786
$85,572
166:1
Craig W. Jelinek
Costco Wholesale
$8,752,252
$45,294
193:1
Thomas E. Jorden
Coterra Energy
$11,061,939
$91,440
131:1
Jay A. Brown
Crown Castle International
$14,553,510
$128,795
113:1
James M. Foote
CSX Corporation
$20,006,806
$107,772
186:1
N. Thomas Linebarger
Cummins
$15,645,919
$53,864
291:1
Karen S. Lynch
CVS Health
$20,388,412
$45,010
458:1
CEO
Company
Compensation
Median employee compensation
Pay ratio
Rainer M. Blair
Danaher
$17,152,267
$66,203
259:1
Javier J. Rodriguez
DaVita
$3,298,439
$67,535
49:1
John C. May
Deere & Company
$19,912,826
$82,240
242:1
Edward H. Bastian
Delta Air Lines
$12,360,420
$70,240
176:1
Donald M. Casey Jr.
Dentsply Sirona
$9,251,885
$56,466
164:1
Richard A. Muncrief
Devon Energy
$11,914,547
$179,900
67:1
Kevin R. Sayer
DexCom
$11,985,324
$63,500
189:1
Travis D. Stice
Diamondback Energy
$13,839,995
$108,354
128:1
A. William Stein
Digital Realty Trust
$17,139,601
$122,276
140:1
Roger C. Hochschild
Discover Financial Services
$12,087,218
$63,770
190:1
Erik W. Carlson
DISH Network
$2,895,882
$58,161
50:1
Todd J. Vasos
Dollar General
$16,618,873
$17,773
935:1
Michael A. Witynski
Dollar Tree
$10,249,698
$13,490
760:1
Robert M. Blue
Dominion Energy
$8,161,083
$110,406
74:1
Richard E. Allison Jr.
Domino’s Pizza
$7,138,002
$17,782
401:1
Richard J. Tobin
Dover
$14,085,860
$48,794
289:1
Jim R. Fitterling
Dow Inc.
$24,858,892
$95,607
260:1
Gerardo Norcia
DTE Energy Company
$11,128,277
$136,472
82:1
Lynn J. Good
Duke Energy
$16,451,236
$115,895
142:1
James B. Connor
Duke Realty
$9,493,924
$148,012
64:1
CEO
Company
Compensation
Median employee compensation
Pay ratio
Edward D. Breen
DuPont de Nemours
$15,106,986
$108,955
139:1
Mark J. Costa
Eastman Chemical Company
$17,798,861
$92,880
192:1
Craig Arnold
Eaton
$19,367,607
$56,287
344:1
Jamie Iannone
eBay Inc.
$21,685,102
$135,528
160:1
Christophe Beck
Ecolab
$8,365,888
$52,339
160:1
Pedro J. Pizarro
Edison International
$14,364,340
$175,717
82:1
Michael A. Mussallem
Edwards Lifesciences
$13,613,305
$73,036
186:1
David A. Ricks
Eli Lilly and Company
$21,509,985
$97,130
221:1
Surendralal (Lal) L. Karsanbhai
Emerson Electric Company
$15,806,036
$42,499
378:1
Badrinarayanan Kothandaraman
Enphase Energy
$19,019,162
$67,267
283:1
Leo P. Denault
Entergy
$17,045,744
$135,272
126:1
Ezra Y. Yacob
EOG Resources
$9,752,887
$185,838
51:1
Arkadiy Dobkin
EPAM Systems
$5,921,525
$27,200
218:1
Mark W. Begor
Equifax
$16,065,575
$90,330
178:1
Charles J. Meyers
Equinix
$23,248,193
$122,075
190:1
Mark J. Parrell
Equity Residential
$8,490,527
$62,996
135:1
Michael J. Schall
Essex Property Trust
$7,183,068
$85,350
84:1
Josh Silverman
Etsy, Inc.
$40,584,292
$231,338
175:1
Juan C. Andrade
Everest Re Group
$8,866,126
$151,276
59:1
David A. Campbell
Evergy
$11,138,082
$133,369
84:1
CEO
Company
Compensation
Median employee compensation
Pay ratio
Joseph R. Nolan Jr.
Eversource Energy
$6,467,078
$133,297
50:1
Christopher M. Crane
Exelon
$15,757,378
$160,633
98:1
Peter M. Kern
Expedia Group
$296,247,749
$102,270
2,897:1
Jeffrey S. Musser
Expeditors International of Washington
$13,026,304
$68,690
190:1
Joseph D. Margolis
Extra Space Storage
$7,315,982
$43,361
169:1
Darren W. Woods
Exxon Mobil
$23,572,488
$189,082
125:1
Franaois Locoh-Donou
F5 Networks
$11,469,726
$206,330
56:1
Daniel L. Florness
Fastenal Company
$2,423,614
$40,843
59:1
Donald C. Wood
Federal Realty Investment Trust
$7,520,917
$125,770
60:1
Gary A. Norcross
Fidelity National Information Services
$25,023,771
$64,135
390:1
Greg D. Carmichael
Fifth Third Bancorp
$10,531,649
$66,720
158:1
Steven E. Strah
FirstEnergy
$10,714,062
$124,120
86:1
Frank J. Bisignano
Fiserv
$20,385,208
$70,276
290:1
Ronald F. Clarke
FleetCor Technologies
$57,923,473
$41,265
1,404:1
Mark Douglas
FMC Corporation
$8,489,671
$54,297
156:1
James D. Farley Jr.
Ford Motor Company
$22,813,174
$64,003
356:1
Ken Xie
Fortinet
$14,203,211
$202,875
70:1
James A. Lico
Fortive
$16,598,719
$61,746
269:1
Nicholas I. Fink
Fortune Brands Home & Security
$10,170,381
$50,540
201:1
Jennifer M. Johnson
Franklin Resources
$9,862,161
$95,117
104:1
CEO
Company
Compensation
Median employee compensation
Pay ratio
Richard C. Adkerson
Freeport-McMoRan
$19,111,894
$77,036
248:1
Clifton A. Pemble
Garmin
$4,238,341
$38,118
111:1
Eugene A. Hall
Gartner
$14,096,168
$118,762
119:1
Aaron Jagdfeld
Generac Holdings
$7,519,812
$65,543
115:1
Phebe N. Novakovic
General Dynamics
$23,553,861
$92,585
254:1
H. Lawrence Culp, Jr.
General Electric Company
$22,663,449
$55,064
412:1
Mary T. Barra
General Motors Company
$29,136,780
$69,433
420:1
Paul D. Donahue
Genuine Parts Company
$11,810,704
$41,606
284:1
Daniel P. O’Day
Gilead Sciences
$19,229,466
$211,687
91:1
Jeffrey S. Sloan
Global Payments
$23,318,393
$56,202
415:1
Larry M. Hutchison
Globe Life
$8,323,666
$56,843
147:1
Gary L. Coleman
Globe Life
$8,353,754
$56,843
147:1
David M. Solomon
The Goldman Sachs Group
$39,545,072
$165,828
238:1
Jeffrey A. Miller
Halliburton Company
$23,591,982
$81,076
291:1
Christopher Swift
The Hartford Financial Services Group
$15,824,348
$106,940
148:1
Richard S. Stoddart
Hasbro
$3,130,233
$82,787
286:1
Samuel N. Hazen
HCA Healthcare
$20,635,260
$56,044
368:1
Thomas M. Herzog
Healthpeak Properties
$11,713,883
$177,521
66:1
Stanley M. Bergman
Henry Schein
$10,786,180
$72,625
121:1
Michele G. Buck
The Hershey Company
$16,144,570
$36,149
447:1
CEO
Company
Compensation
Median employee compensation
Pay ratio
Seifollah Seifi Ghasemi
Air Products & Chemicals
$13,819,010
$68,613
201:1
F. Thomson Leighton
Akamai Technologies
$11,951,574
$112,018
107:1
Benito Minicucci
Alaska Air Group
$5,130,162
$74,911
69:1
J. Kent Masters, Jr.
Albemarle
$9,040,753
$70,574
128:1
Peter M. Moglia
Alexandria Real Estate Equities
$8,274,131
$176,113
72:1
Stephen A. Richardson
Alexandria Real Estate Equities
$8,320,228
$176,113
72:1
Joseph M. Hogan
Align Technology
$21,591,400
$13,011
1,659:1
David D. Petratis
Allegion
$7,688,243
$65,338
118:1
John O. Larsen
Alliant Energy
$10,449,260
$110,610
94:1
John C. Plant
Howmet Aerospace
$17,189,000
$58,921
415:1
Enrique J. Lores
HP Inc.
$20,733,806
$67,667
306:1
Bruce D. Broussard
Humana
$16,528,036
$64,797
255:1
John N. Roberts III
J.B. Hunt Transport Services
$8,801,881
$78,560
112:1
Stephen D. Steinour
Huntington Bancshares
$9,619,178
$58,430
165:1
Michael C. Petters
Huntington Ingalls Industries
$7,714,067
$69,551
111:1
Eric D. Ashleman
IDEX Corporation
$6,719,772
$61,933
109:1
Jonathan J. Mazelsky
IDEXX Laboratories
$9,065,021
$67,638
134:1
E. Scott Santi
Illinois Tool Works
$20,787,622
$61,011
341:1
Francis A. Desouza
Illumina
$14,333,634
$115,398
124:1
Herve Hoppenot
Incyte
$14,444,265
$248,810
58:1
CEO
Company
Compensation
Median employee compensation
Pay ratio
Vicente Reynal
Ingersoll Rand
$10,613,486
$51,757
205:1
Patrick P. Gelsinger
Intel
$178,590,400
$104,400
1,711:1
Jeffrey C. Sprecher
Intercontinental Exchange
$14,788,386
$125,579
118:1
Arvind Krishna
International Business Machines
$17,550,959
$45,197
258:1
Andreas Fibig
International Flavors & Fragrances
$9,767,380
$66,105
148:1
Mark S. Sutton
International Paper Company
$15,228,707
$88,581
172:1
Philippe Krakowsky
The Interpublic Group of Companies
$17,371,647
$59,814
290:1
Gary S. Guthart
Intuitive Surgical
$8,059,409
$140,163
58:1
Martin L. Flanagan
Invesco
$12,897,752
$187,854
69:1
Eugene Scherbakov
IPG Photonics
$7,284,851
$44,504
169:1
Ari Bousbib
IQVIA Holdings
$28,615,851
$139,803
205:1
William L. Meaney
Iron Mountain
$17,046,118
$41,600
410:1
Steven J. Demetriou
Jacobs Engineering Group
$16,275,230
$91,393
178:1
Alex Gorsky
Johnson & Johnson
$26,741,959
$90,000
297:1
George R. Oliver
Johnson Controls International
$15,667,017
$43,640
359:1
James Dimon
JPMorgan Chase & Co.
$84,428,145
$92,112
917:1
Rami Rahim
Juniper Networks
$11,870,290
$132,117
90:1
Steve Cahillane
Kellogg Company
$10,678,337
$44,125
242:1
Christopher M. Gorman
KeyCorp
$8,653,484
$73,571
118:1
Ronald S. Nersesian
Keysight Technologies
$18,566,410
$77,082
241:1
CEO
Company
Compensation
Median employee compensation
Pay ratio
Michael D. Hsu
Kimberly-Clark
$12,009,162
$42,749
281:1
Conor C. Flynn
Kimco Realty
$4,190,057
$108,000
97:1
Steven J. Kean
Kinder Morgan
$18,000,259
$115,388
167:1
Miguel Patricio
The Kraft Heinz Company
$8,605,599
$45,260
190:1
W. Rodney Mcmullen
The Kroger Company
$18,168,730
$26,763
679:1
Christopher E. Kubasik
L3Harris Technologies
$15,697,749
$110,846
142:1
Robert G. Goldstein
Las Vegas Sands
$31,204,900
$35,879
866:1
Roger A. Krone
Leidos Holdings
$12,876,007
$95,935
134:1
Jonathan M. Jaffe
Lennar
$34,045,217
$101,561
335:1
Rick Beckwitt
Lennar
$34,045,217
$101,561
335:1
Dennis R. Glass
Lincoln National
$16,760,924
$84,240
199:1
Michael Rapino
Live Nation Entertainment
$13,842,464
$15,740
879:1
Dominick P. Zarcone
LKQ Corporation
$9,445,636
$38,982
242:1
James D. Taiclet Jr.
Lockheed Martin
$18,111,211
$110,113
164:1
James S. Tisch
Loews
$6,119,523
$53,781
114:1
Marvin R. Ellison
Lowe’s Companies
$17,871,716
$22,697
787:1
Jeffrey K. Storey
Lumen Technologies
$22,654,781
$75,984
298:1
Bhavesh (Bob) Patel
LyondellBasell Industries NV
$19,011,033
$106,258
179:1
Rene F. Jones
M&T Bank
$6,868,174
$68,270
101:1
Lee M. Tillman
Marathon Oil
$12,997,292
$128,010
102:1
CEO
Company
Compensation
Median employee compensation
Pay ratio
Michael J. Hennigan
Marathon Petroleum
$21,185,206
$148,850
142:1
Richard M. Mcvey
MarketAxess Holdings
$5,742,184
$162,120
35:1
Anthony G. Capuano
Marriott International
$18,391,882
$36,505
506:1
Daniel S. Glaser
Marsh & McLennan Companies
$21,519,703
$67,143
321:1
C. Howard Nye
Martin Marietta Materials
$14,939,587
$90,423
165:1
Keith J. Allman
Masco
$13,410,774
$50,305
267:1
Michael Miebach
Mastercard
$16,120,055
$128,154
126:1
Sharmistha Dubey
Match Group
$25,397,675
$106,881
238:1
Lawrence E. Kurzius
McCormick & Company
$12,718,656
$38,004
335:1
Christopher J. Kempczinski
McDonald’s
$20,028,132
$8,897
2,251:1
Robert M. Davis
Merck & Co.
$13,722,121
$102,803
133:1
Mark Zuckerberg
Meta Platforms
$26,823,061
$292,785
92:1
Michel A. Khalaf
MetLife
$16,621,373
$76,392
218:1
Patrick Kaltenbach
Mettler-Toledo International
$11,811,322
$51,436
233:1
William J. Hornbuckle IV
MGM Resorts International
$13,274,524
$34,988
379:1
Sanjay Mehrotra
Micron Technology
$25,316,709
$64,827
391:1
H. Eric Bolton, Jr.
Mid-America Apartment Communities
$7,667,655
$52,777
145:1
Stephane Bancel
Moderna
$18,155,739
$133,074
136:1
Jeffrey S. Lorberbaum
Mohawk Industries
$5,190,696
$36,391
143:1
Joseph M. Zubretsky
Molina Healthcare
$19,961,698
$71,916
278:1
CEO
Company
Compensation
Median employee compensation
Pay ratio
Gavin D.K. Hattersley
Molson Coors Beverage Company
$8,234,680
$77,432
106:1
Dirk Van De Put
Mondelez International
$16,128,320
$31,024
520:1
Hilton H. Schlosberg
Monster Beverage
$16,686,528
$69,417
240:1
Rodney C. Sacks
Monster Beverage
$16,707,577
$69,417
241:1
Robert Fauber
Moody’s
$9,750,157
$88,985
110:1
James P. Gorman
Morgan Stanley
$34,941,635
$137,069
255:1
James (‘Joc’) C. O’Rourke
The Mosaic Company
$12,297,011
$24,013
512:1
Gregory Q. Brown
Motorola Solutions
$19,980,639
$82,965
241:1
Henry A. Fernandez
MSCI Inc.
$10,338,312
$58,415
177:1
Adena T. Friedman
Nasdaq
$19,965,893
$98,946
202:1
Ted A. Sarandos
Netflix
$38,232,164
$201,743
190:1
Reed Hastings
Netflix
$40,823,725
$201,743
202:1
Ravichandra K. Saligram
Newell Brands
$11,438,798
$33,913
337:1
Thomas Palmer
Newmont
$12,667,106
$56,621
224:1
Robert J. Thomson
News Corporation
$23,024,845
$68,984
334:1
John W. Ketchum
NextEra Energy
$15,507,153
$132,798
191:1
David Kenny
Nielsen Holdings
$13,798,346
$48,802
283:1
Joseph Hamrock
NiSource
$9,535,782
$124,663
76:1
Sundaram Nagarajan
Nordson
$10,308,750
$65,527
157:1
James A. Squires
Norfolk Southern
$14,016,942
$99,945
140:1
CEO
Company
Compensation
Median employee compensation
Pay ratio
Michael G. O’Grady
Northern Trust
$10,449,233
$72,300
145:1
Kathy J. Warden
Northrop Grumman
$19,876,767
$119,721
166:1
Frank J. Del Rio
Norwegian Cruise Line Holdings
$19,668,768
$19,319
1,018:1
Mauricio Gutierrez
NRG Energy
$10,854,224
$126,289
86:1
Leon J. Topalian
Nucor
$11,618,019
$142,635
81:1
Jen-Hsun Huang
NVIDIA
$23,737,661
$217,542
109:1
Paul C. Saville
NVR, Inc.
$4,162,400
$71,417
58:1
Kurt Sievers
NXP Semiconductors NV
$20,911,892
$50,138
417:1
Greg D. Johnson
O’Reilly Automotive
$12,764,271
$28,113
454:1
Vicki A. Hollub
Occidental Petroleum
$11,068,539
$157,013
71:1
Greg C. Gantt
Old Dominion Freight Line
$10,577,833
$72,726
145:1
John D. Wren
Omnicom Group
$19,981,715
$50,612
395:1
Pierce H. Norton II
ONEOK
$7,246,578
$119,568
79:1
Kevin Ali
Organon & Co.
$16,787,623
N/A
N/A
Judith F. Marks
Otis Worldwide
$13,770,306
$49,941
276:1
Preston R. Feight
PACCAR
$11,935,763
$107,529
111:1
Mark W. Kowlzan
Packaging Corporation of America
$12,157,313
$78,062
156:1
Robert M. Bakish
Paramount Global
$20,035,212
$94,580
212:1
Chad R. Richison
Paycom Software
$2,958,410
$70,036
42:1
Daniel H. Schulman
PayPal Holdings
$32,070,353
$83,905
382:1
CEO
Company
Compensation
Median employee compensation
Pay ratio
Jay A. Snowden
Penn National Gaming
$65,887,214
$33,930
1,942:1
John L. Stauch
Pentair
$9,429,546
$57,343
164:1
Ramon L. Laguarta
PepsiCo
$25,506,607
$52,297
488:1
Prahlad R. Singh
PerkinElmer
$9,661,006
$52,960
182:1
Albert Bourla
Pfizer
$24,353,219
$92,986
262:1
Jacek Olczak
Philip Morris International
$10,557,568
$18,196
1,055:1
Greg C. Garland
Phillips 66
$20,953,206
$161,584
130:1
Jeffrey B. Guldner
Pinnacle West Capital
$8,100,157
$136,805
59:1
Scott D. Sheffield
Pioneer Natural Resources Company
$16,002,825
$166,480
96:1
William S. Demchak
The PNC Financial Services Group
$17,506,270
$78,333
224:1
Peter D. Arvan
Pool Corporation
$5,575,384
$61,709
90:1
Michael H. Mcgarry
PPG Industries
$13,199,616
$37,282
354:1
Vincent Sorgi
PPL Corporation
$11,356,481
$147,670
77:1
William J. Stromberg
T. Rowe Price Group
$17,127,330
$138,173
124:1
Daniel J. Houston
Principal Financial Group
$17,566,163
$75,348
236:1
Susan Patricia Griffith
The Progressive Corporation
$14,462,961
$65,874
220:1
Hamid R. Moghadam
Prologis
$24,901,490
$114,183
218:1
Charles F. Lowrely
Prudential Financial
$19,799,737
$114,931
172:1
James E. Heppelmann
PTC Inc.
$13,048,375
$109,266
119:1
Ralph Izzo
Public Service Enterprise Group
$14,208,674
$146,034
97:1
CEO
Company
Compensation
Median employee compensation
Pay ratio
Joseph D. Russell Jr.
Public Storage
$10,358,153
$28,787
360:1
Ryan R. Marshall
PulteGroup
$16,149,555
$136,630
118:1
Cristiano R. Amon
Qualcomm
$20,638,924
$98,200
215:1
Earl. C. (Duke) Austin, Jr.
Quanta Services
$10,967,217
$106,665
103:1
Stephen H. Rusckowski
Quest Diagnostics
$14,557,818
$67,206
217:1
Paul C. Reilly
Raymond James Financial
$13,901,046
$106,782
130:1
Gregory J. Hayes
Raytheon Technologies
$23,316,063
$112,078
208:1
Sumit Roy
Realty Income
$12,861,011
$136,304
94:1
Lisa Palmer
Regency Centers
$7,026,315
$111,237
63:1
Leonard S. Schleifer
Regeneron Pharmaceuticals
$6,470,514
$149,250
43:1
John M. Turner Jr.
Regions Financial
$13,444,577
$79,540
169:1
Jon Vander Ark
Republic Services
$7,925,408
$68,217
125:1
M. Keith Waddell
Robert Half International
$8,971,474
$28,191
318:1
Blake D. Moret
Rockwell Automation
$13,583,470
$59,041
230:1
Gary W. Rollins
Rollins
$8,393,601
$44,843
187:1
L. Neil Hunn
Roper Technologies
$21,532,055
$98,550
219:1
Barbara Rentler
Ross Stores
$15,989,635
$10,806
1,480:1
Richard D. Fain
Royal Caribbean Cruises
$15,812,027
$14,706
1,075:1
Douglas L. Peterson
S&P Global
$16,143,770
$27,835
580:1
Marc Benioff
Salesforce.com
$28,602,112
$181,612
157:1
CEO
Company
Compensation
Median employee compensation
Pay ratio
Bret Taylor
Salesforce.com
$22,794,415
$181,612
126:1
Jeffrey A. Stoops
SBA Communications
$9,995,179
$96,104
104:1
Olivier Le Peuch
Schlumberger
$16,795,502
$66,138
254:1
Walter W. Bettinger II
The Charles Schwab Corporation
$21,938,404
$109,269
201:1
Edward L. Doheny II
Sealed Air
$9,674,692
$54,633
177:1
Jeffrey W. Martin
Sempra Energy
$24,675,982
$137,800
179:1
William R. Mcdermott
ServiceNow
$165,802,037
$233,859
709:1
John G. Morikis
The Sherwin-Williams Company
$15,843,760
$43,321
366:1
David Simon
Simon Property Group
$10,475,192
$64,069
163:1
Liam K. Griffin
Skyworks Solutions
$16,150,421
$17,409
928:1
Kevin J. Wheeler
A. O. Smith
$6,897,982
$35,561
194:1
Nicholas T. Pinchuk
Snap-on
$9,872,946
$59,712
165:1
Zivi Lando
SolarEdge Technologies
$7,361,336
$78,132
94:1
Thomas A. Fanning
The Southern Company
$21,243,559
$132,450
161:1
Robert E. Jordan
Southwest Airlines Company
$3,049,336
$84,872
69:1
James M. Loree
Stanley Black & Decker
$13,167,893
$56,016
235:1
Kevin R. Johnson
Starbucks
$20,425,163
$12,935
1,579:1
Ronald P. O’Hanley
State Street
$14,113,660
$61,463
230:1
Kevin A. Lobo
Stryker
$16,359,898
$76,715
213:1
Greg W. Becker
SVB Financial Group
$9,922,132
$125,638
79:1
CEO
Company
Compensation
Median employee compensation
Pay ratio
Brian D. Doubles
Synchrony Financial
$8,880,347
$50,316
177:1
Aart J. De Geus
Synopsys
$9,974,985
$98,215
102:1
Chi Foon Chan
Synopsys
$9,976,485
$98,215
102:1
G. Michael Sievert
T-Mobile US
$22,610,659
$72,572
312:1
Brian C. Cornell
Target
$19,758,766
$25,501
775:1
Terrence R. Curtin
TE Connectivity
$14,715,856
$24,975
589:1
Robert Mehrabian
Teledyne Technologies
$6,567,058
$64,003
103:1
Liam J. Kelly
Teleflex
$8,673,634
$34,907
248:1
Mark E. Jagiela
Teradyne
$10,954,713
$128,299
85:1
Richard K. Templeton
Texas Instruments
$19,195,411
$69,407
277:1
Scott C. Donnelly
Textron
$18,576,014
$102,647
181:1
Marc N. Casper
Thermo Fisher Scientific
$21,234,358
$83,666
254:1
Ernie Herrman
The TJX Companies
$31,802,000
$14,139
2,249:1
Harry A. Lawton III
Tractor Supply Company
$11,117,251
$29,047
383:1
Dave S. Regnery
Trane Technologies
$12,888,518
$63,916
202:1
Kevin M. Stein
TransDigm Group
$21,484,504
$58,837
365:1
Alan D. Schnitzer
The Travelers Companies
$19,853,697
$109,586
181:1
Robert G. Painter
Trimble
$13,956,821
$71,625
195:1
William H. Rogers, Jr.
Truist Financial
$10,395,426
$95,659
153:1
Parag Agrawal
Twitter
$30,351,152
$232,626
130:1
CEO
Company
Compensation
Median employee compensation
Pay ratio
James M. Cracchiolo
Ameriprise Financial
$21,229,464
$129,010
165:1
Steven H. Collis
AmerisourceBergen
$14,873,815
$65,076
229:1
David A. Zapico
AMETEK
$12,919,431
$68,238
189:1
Robert A. Bradway
Amgen
$21,721,154
$130,589
166:1
R. Adam Norwitt
Amphenol
$13,092,697
$16,042
816:1
Vincent T. Roche
Analog Devices
$30,824,323
$46,141
668:1
Ajei S. Gopal
ANSYS
$18,260,634
$118,588
154:1
Gail K. Boudreaux
Anthem
$19,348,241
$51,005
379:1
John J. Christmann IV
APA Corporation
$15,040,707
$174,903
86:1
Andrew P. Witty
UnitedHealth Group
$18,433,143
$61,379
301:1
Marc D. Miller
Universal Health Services
$14,020,942
$45,454
309:1
Andrew Cecere
U.S. Bancorp
$19,166,276
$85,166
225:1
Joseph W. Gorder
Valero Energy
$22,684,706
$198,219
114:1
Debra A. Cafaro
Ventas
$14,263,728
$111,261
128:1
D. James Bidzos
VeriSign
$10,118,313
$201,444
50:1
Scott G. Stephenson
Verisk Analytics
$12,796,321
$72,679
176:1
Hans Vestberg
Verizon Communications
$20,342,871
$122,492
166:1
Reshma Kewalramani
Vertex Pharmaceuticals
$15,198,856
$234,107
65:1
Michael Goettler
Viatris
$14,669,592
$36,865
398:1
Alfred F. Kelly Jr.
Visa Inc.
$30,944,838
$146,420
211:1
CEO
Company
Compensation
Median employee compensation
Pay ratio
Steven L. Roth
Vornado Realty Trust
$9,763,351
$62,287
157:1
Thomas J. Hill
Vulcan Materials Company
$10,420,114
$80,122
130:1
Donald G. Macpherson
W.W. Grainger
$9,015,594
$65,633
138:1
Rosalind Gates Brewer
Walgreens Boots Alliance
$28,333,498
$26,255
1,084:1
C. Douglas Mcmillon
Walmart
$25,670,673
$25,335
1,013:1
Robert A. Chapek
The Walt Disney Company
$32,464,293
$50,430
644:1
David M. Zaslav
Warner Bros. Discovery
$246,573,481
$82,964
2,972:1
James C. Fish Jr.
Waste Management
$13,057,363
$80,744
162:1
Udit Batra
Waters
$8,653,559
$74,470
116:1
J. Kevin Fletcher
WEC Energy Group
$18,481,871
$122,530
151:1
Charles W. Scharf
Wells Fargo & Company
$21,350,906
$73,578
290:1
Shankh Mitra
Welltower
$12,753,710
$100,206
127:1
Eric M. Green
West Pharmaceutical Services
$9,467,111
$57,357
161:1
Rafael Santana
Westinghouse Air Brake Technologies
$11,027,238
$45,266
244:1
David B. Sewell
WestRock Company
$21,189,086
$63,560
333:1
Devin W. Stockfish
Weyerhaeuser Company
$12,715,531
$76,688
166:1
Marc R. Bitzer
Whirlpool
$18,751,901
$27,128
692:1
Alan S. Armstrong
The Williams Companies
$13,759,533
$167,343
82:1
Carl Hess
Willis Towers Watson
$4,828,485
$66,942
304:1
Craig S. Billings
Wynn Resorts
$10,713,346
$44,048
294:1
CEO
Company
Compensation
Median employee compensation
Pay ratio
Robert C. Frenzel
Xcel Energy
$8,350,364
$122,532
95:1
Patrick K. Decker
Xylem
$10,441,670
$55,094
190:1
David W. Gibbs
Yum! Brands
$27,578,659
$13,082
2,108:1
Anders Gustafsson
Zebra Technologies
$13,589,616
$60,450
225:1
Bryan C. Hanson
Zimmer Biomet Holdings
$14,981,058
$63,981
234:1
Harris H. Simmons
Zions Bancorporation NA
$4,656,113
$76,160
61:1
Kristin C. Peck
Zoetis
$13,098,491
$81,497
161:1
Contact [email protected]