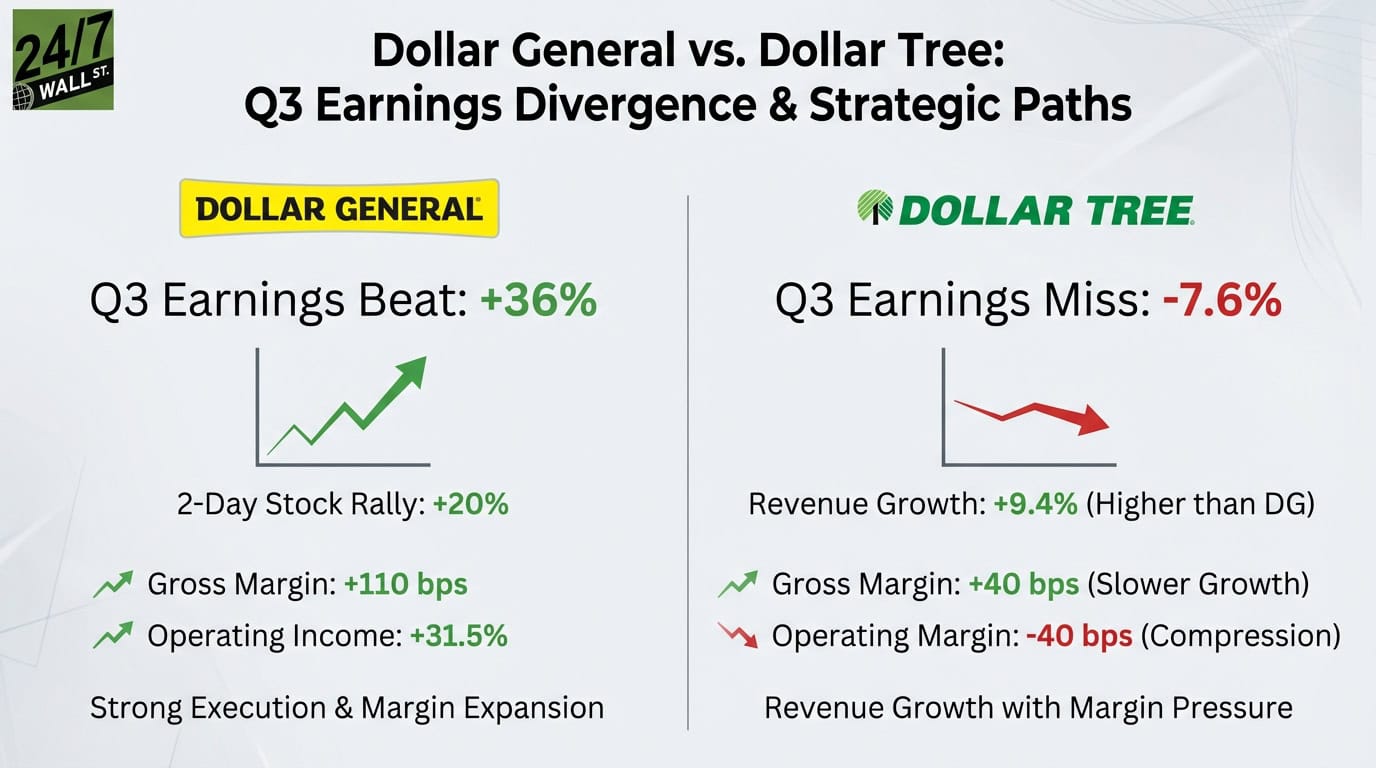
Dollar General (NYSE: DG | DG Price Prediction) and Dollar Tree (NASDAQ: DLTR) both reported November quarter results this week with wildly different outcomes. Dollar General beat earnings by 36% on December 4th, driving a 20% two-day rally. Dollar Tree missed estimates by 7.6% on December 2nd despite stronger revenue growth. The contrast shows which discount retailer is winning on fundamentals.
Dollar General Delivers, Dollar Tree Stumbles
Dollar General reported Q3 earnings of $1.28 per share against estimates of $0.94, a $0.34 surprise marking its fourth consecutive quarterly beat. Revenue of $10.65 billion edged past the $10.60 billion consensus despite 4.6% year-over-year growth. Gross margin climbed 110 basis points to 29.9% from higher inventory markups and lower shrink. Operating income jumped 31.5% to $425.9 million.
CEO Todd Vasos announced 4,885 real estate projects planned for fiscal 2026. Same-store sales rose 2.5%, driven by pricing power and a shift toward higher-margin categories. The company is pushing customers toward zero-sugar beverages and premium packaging.
Dollar Tree’s Q3 told a messier story. Revenue of $4.75 billion missed the $4.79 billion estimate despite 9.4% year-over-year growth, double Dollar General’s pace. Adjusted earnings of $1.21 per share beat the $1.10 estimate, but gross margin expanded only 40 basis points to 35.8%. Operating margin declined 40 basis points to 7.2%, even as revenue accelerated. Same-store sales of 4.2% beat Dollar General’s 2.5%, but margin compression suggests growth came at a cost.
CEO Mike Creedon highlighted “an all-time record Halloween season” and emphasized the multi-price strategy, with 85% of assortment still at $2 or less. Average ticket rose 4.5%, indicating customers are trading up. But the operating margin decline raises questions about whether multi-price expansion is sustainable without eroding profitability.
| Metric | Dollar General | Dollar Tree |
| Revenue Growth | 4.6% YoY | 9.4% YoY |
| Gross Margin Change | +110 bps | +40 bps |
| Operating Margin Change | Improved | -40 bps |
| Same-Store Sales | 2.5% | 4.2% |
Diverging Paths on Capital and Strategy
Dollar General is prioritizing dividends and real estate expansion. The company declared a $0.59 quarterly dividend payable January 20th and guided fiscal 2025 capex to the lower end of its $1.3 billion to $1.4 billion range. Dollar Tree has deployed $1.5 billion on share buybacks year-to-date under its $2.5 billion program, signaling management confidence but also suggesting limited organic growth opportunities.
Dollar General’s strategy centers on premiumization and brand strength, leveraging pricing power to push customers into higher-margin products. Dollar Tree is betting on multi-price flexibility, converting 646 stores to the Dollar Tree 3.0 format and expanding beyond the traditional $1 price point. It’s a portfolio balancing act that spreads risk but lacks Dollar General’s focused execution.
Contrasting Fundamentals After Q3 Results
Dollar General’s fundamentals show stronger margin expansion after this quarter. The 110-basis-point gross margin expansion while maintaining pricing power demonstrates operational discipline that Dollar Tree isn’t matching. Dollar General’s forward P/E of 14.71 reflects 43.8% earnings growth acceleration, while Dollar Tree trades at a forward P/E of 17.48 despite slower earnings momentum and negative profit margins in the trailing twelve months.
Dollar Tree’s higher same-store sales of 4.2% outpace Dollar General’s 2.5%, but operating margin compression of 40 basis points raises sustainability questions. Dollar Tree demonstrates higher revenue growth at 9.4% year-over-year, while Dollar General shows margin expansion and clearer profitability metrics with gross margin improvement of 110 basis points and operating income growth of 31.5%.
Contact [email protected] for any questions or corrections.