AMZU Let’s You Bet 200% On Amazon But That Doesn’t Mean You Should

Photo of Austin Smith
By Austin Smith Published

Quick Read

  • AMZU lost 23.15% over the past year while Amazon dropped only 1.64%. Volatility decay eroded 20 percentage points beyond what 2x leverage predicts.

  • The fund holds just 13.57% in direct Amazon equity. Daily rebalancing of derivatives creates compounding drag that destroys long-term returns.

  • Amazon gained 3.63% year-to-date but AMZU lost 13.99%. This 21-percentage-point shortfall stems from daily leverage resets during choppy markets.

  • It sounds nuts, but SoFi is giving new active invest users up to $1,000 in stock for a limited time, and all it takes is a $50 deposit to get started. See for yourself (Sponsor)
    DISCLOSURE:
    INVESTMENTS ARE NOT FDIC INSURED • ARE NOT BANK GUARANTEED • MAY LOSE VALUE Brokerage and Active investing products offered through SoFi Securities LLC, member FINRA(www.finra.org)/SIPC(www.sipc.org). Advisory services are offered by SoFi Wealth LLC, an SEC-registered investment adviser. Information about SoFi Wealth’s advisory operations, services, and fees is set forth in SoFi Wealth’s current Form ADV Part 2 (Brochure), a copy of which is available upon request and at www.adviserinfo.sec.gov. Probability of Member receiving $1,000 is a probability of 0.026%; If you don’t make a selection in 30 days, you’ll no longer qualify for the promo. Customer must fund their account with a minimum of $50.00 to qualify. Other fees, such as exchange fees, may apply. Please view our fee disclosure to view a full listing of fees. Investing in alternative investments and/or strategies may not be suitable for all investors and involves unique risks, including the risk of loss. An investor should consider their individual circumstances and any investment information, such as a prospectus, prior to investing. Interval Funds are illiquid instruments, the ability to trade on your timeline may be restricted. Brokerage and Active investing products offered through SoFi Securities LLC, Member FINRA(www.finra.org) /SIPC(www.sipc.org). There are limitations with fractional shares to consider before investing. During market hours fractional share orders are transmitted immediately in the order received. There may be system delays from receipt of your order until execution and market conditions may adversely impact execution prices. Outside of market hours orders are received on a not held basis and will be aggregated for each security then executed in the morning trade window of the next business day at market open. Share will be delivered at an average price received for executing the securities through a single batched order. Fractional shares may not be transferred to another firm. Fractional shares will be sold when a transfer or closure request is initiated. Please consider that selling securities is a taxable event. Options involve risks, including substantial risk of loss and the possibility an investor may lose the entire investment Before trading options please review the Characteristics and Risks of Standardized Options  Investing in an Initial Public Offering (IPO) involves substantial risk, including the risk of loss. Further, there are a variety of risk factors to consider when investing in an IPO, including but not limited to, unproven management, significant debt, and lack of operating history. For a comprehensive discussion of these risks please refer to SoFi Securities’ IPO Risk Disclosure Statement This should not be considered a recommendation to participate in IPOs and investors should carefully read the offering prospectus to determine whether an offering is consistent with their investment objectives, risk tolerance, and financial situation. New offerings generally have high demand and there are a limited number of shares available for distribution to participants. Many customers may not be allocated shares and share allocations may be significantly smaller than the shares requested in the customer’s initial offer (Indication of Interest). For more information on the allocation process please visit IPO Allocation.
This post may contain links from our sponsors and affiliates, and Flywheel Publishing may receive compensation for actions taken through them.
AMZU Let’s You Bet 200% On Amazon But That Doesn’t Mean You Should

© 24/7 Wall St.

Direxion Daily AMZN Bull 2X Shares (NYSEARCA:AMZU) offers 200% daily exposure to Amazon (NASDAQ:AMZN | AMZN Price Prediction), but its mechanics reveal why it’s designed for short-term traders, not income investors. Understanding how AMZU generates distributions and its structural risks is critical before investing.

How AMZU Generates Income

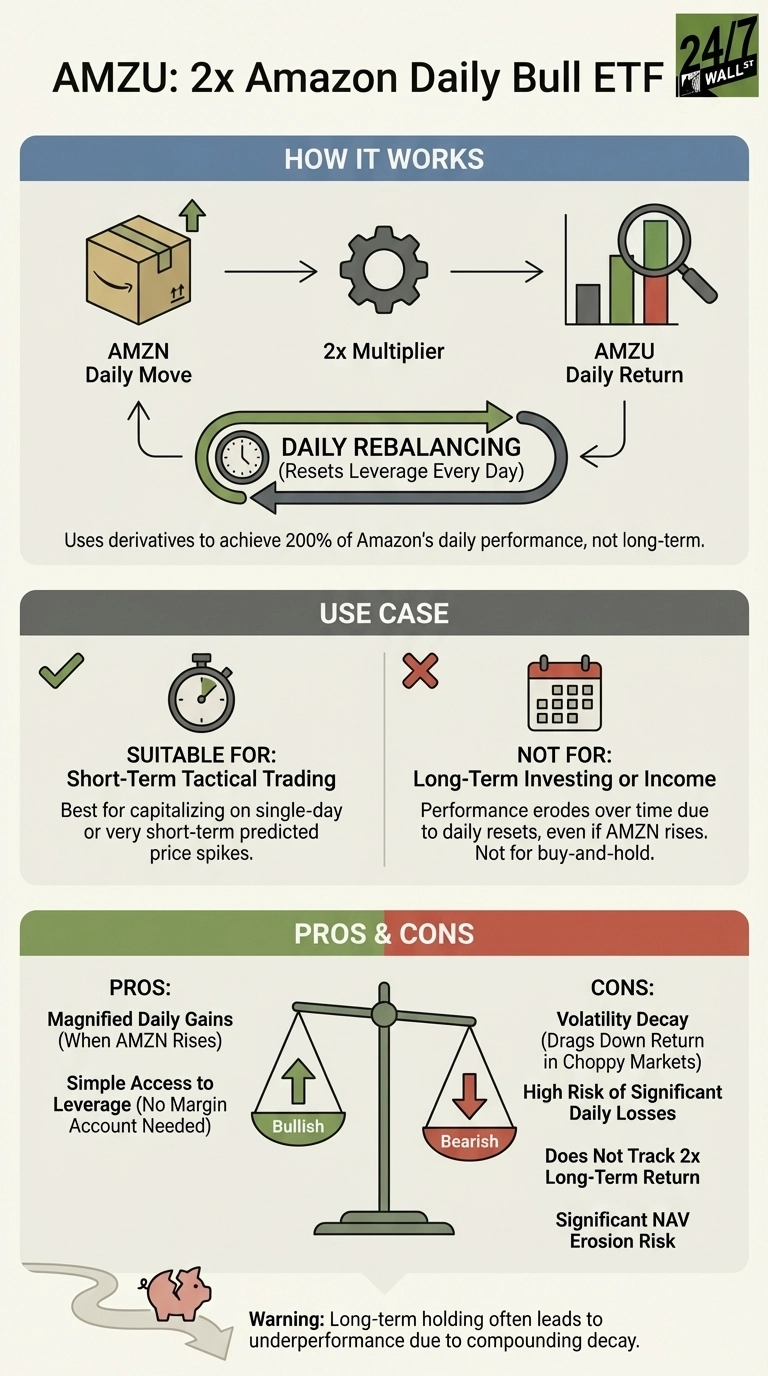
AMZU doesn’t generate income through traditional dividends. It uses derivatives, swaps, and daily rebalancing to achieve 200% exposure to Amazon’s daily price movements. When Amazon pays a dividend, AMZU receives the distribution amplified through leverage, but at significant cost. The ETF paid a $1.20 special dividend in December 2025, but this must be evaluated against substantial NAV erosion from volatility decay.

The fund holds only 13.57% in direct Amazon equity, with the remainder in derivatives for daily 2x leverage. This structure resets leverage daily, creating compounding drag that destroys long-term returns even when the underlying stock performs well.

An infographic titled 'AMZU: 2x Amazon Daily Bull ETF' explains the product. The 'How It Works' section shows an Amazon box representing AMZN Daily Move, leading to a gear icon for '2x Multiplier', then a bar chart with a magnifying glass for 'AMZU Daily Return'. A circular arrow indicates 'Daily Rebalancing (Resets Leverage Every Day)' connecting back. Text states it 'Uses derivatives to achieve 200% of Amazon’s daily performance, not long-term.' The 'Use Case' section has a green check and stopwatch icon for 'Suitable For: Short-Term Tactical Trading' and a red cross and calendar icon for 'Not For: Long-Term Investing or Income'. The 'Pros & Cons' section features a green balance scale with an upward arrow labeled 'Bullish' and a red downward arrow labeled 'Bearish'. Pros listed are 'Magnified Daily Gains (When AMZN Rises)' and 'Simple Access to Leverage'. Cons are 'Volatility Decay', 'High Risk of Significant Daily Losses', 'Does Not Track 2x Long-Term Return', and 'Significant NAV Erosion Risk'. A broken piggy bank icon points to a warning: 'Long-term holding often leads to underperformance due to compounding decay'.
24/7 Wall St.
This infographic explains the mechanics, use cases, and inherent risks of holding the AMZU ETF, emphasizing its short-term tactical trading purpose over long-term investing.

The Devastating Math of Leverage Decay

While Amazon declined 1.64% over the past year, AMZU lost 23.15% – nearly 20 percentage points beyond what 2x leverage predicts. The S&P 500 gained 12.63% and the Nasdaq-100 surged 20.70% over the same period.


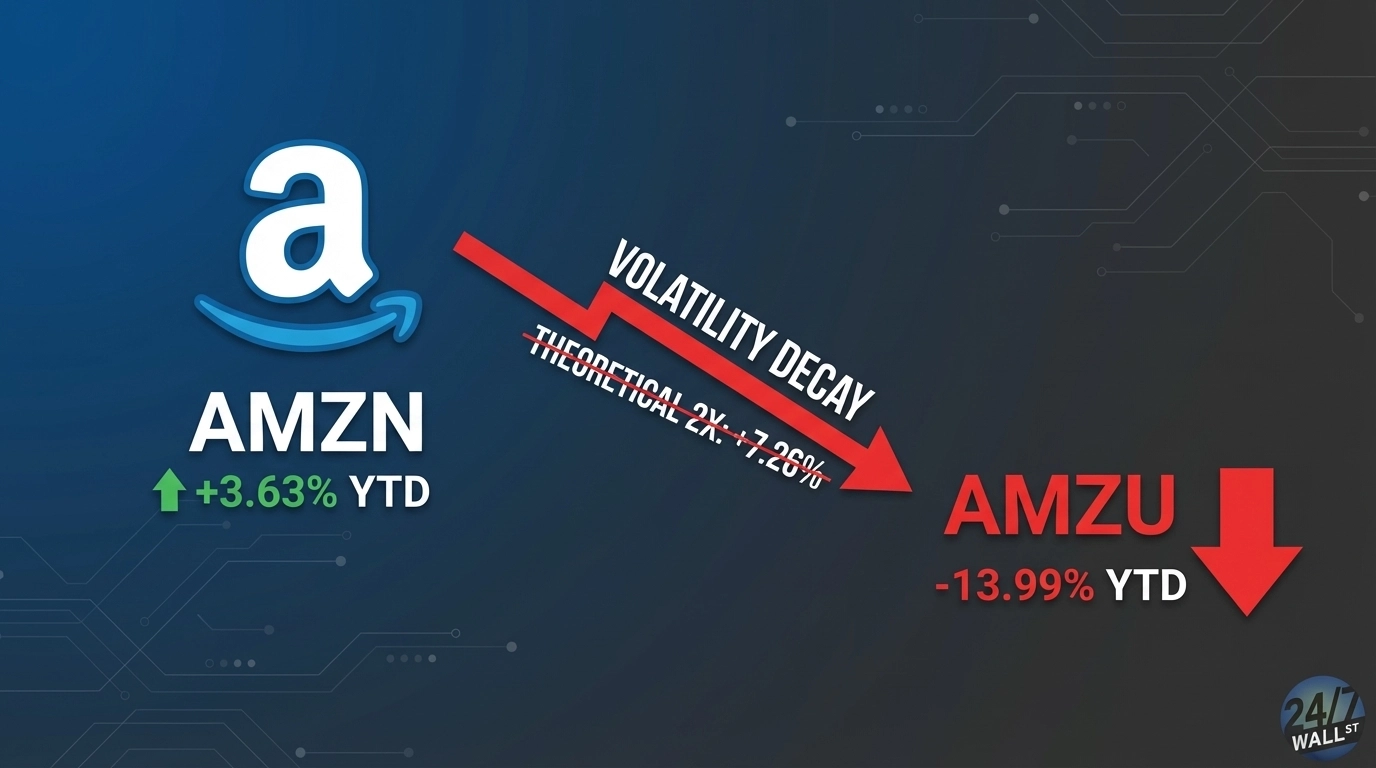
Year-to-date through December 2025, Amazon gained 3.63%, which should theoretically produce a 7.26% return for AMZU. Instead, the fund lost 13.99% – a 21-percentage-point shortfall from volatility decay. This occurs because daily resets lock in losses during choppy markets. When Amazon drops 2% one day and rises 2% the next, AMZU doesn’t return to breakeven due to compounding effects.


Recent volatility illustrates the problem. In December 2025, Amazon experienced multiple 3-4% daily swings, with intraday ranges exceeding $7. On December 17, the stock dropped 4.4%. These moves amplify decay as AMZU rebalances derivatives at the worst times.

Distribution Sustainability and Total Return Reality

While AMZU’s $1.20 special dividend might seem attractive, total return matters more. High yield means nothing if the ETF price collapses. Since inception in September 2022, AMZU has consistently underperformed its theoretical 2x target during volatile periods.

Amazon’s fundamentals remain strong—Q3 2025 revenue of $180.2 billion and net income of $21.2 billion both beat estimates. AWS sales grew 20%, and the company maintains 24.3% return on equity with a healthy balance sheet. However, these positives don’t translate to AMZU performance due to daily resets.

The ETF’s $321.5 million in assets and limited three-year track record provide insufficient data for long-term distribution patterns. The structure guarantees volatility will erode returns over extended periods, making dividend sustainability irrelevant when capital losses exceed income received.

A Better Alternative for Leveraged Exposure

For leveraged technology exposure without single-stock concentration risk, ProShares UltraPro QQQ (NASDAQ:TQQQ) offers better diversification. TQQQ provides 3x daily exposure to the Nasdaq-100 Index, including Amazon alongside 99 other leading technology companies.

TQQQ generates income from dividends across the entire Nasdaq-100. The fund’s $24 billion asset base and track record since 2010 provide more reliable performance data. While TQQQ still suffers from volatility decay inherent to leveraged ETFs, diversification across 100 stocks creates smoother daily movements than AMZU’s single-stock concentration. For tactical traders seeking short-term leveraged exposure, TQQQ’s broader base and deeper liquidity make it more practical than betting 200% on Amazon alone.

Photo of Austin Smith
About the Author Austin Smith →

Austin Smith is a financial publisher with over two decades of experience in the markets. He spent over a decade at The Motley Fool as a senior editor for Fool.com, portfolio advisor for Millionacres, and launched new brands in the personal finance and real estate investing space.

His work has been featured on Fool.com, NPR, CNBC, USA Today, Yahoo Finance, MSN, AOL, Marketwatch, and many other publications. Today he writes for 24/7 Wall St and covers equities, REITs, and ETFs for readers. He is as an advisor to private companies, and co-hosts The AI Investor Podcast.

When not looking for investment opportunities, he can be found skiing, running, or playing soccer with his children. Learn more about me here.

Featured Reads

Our top personal finance-related articles today. Your wallet will thank you later.

Continue Reading

Top Gaining Stocks

ENPH Vol: 20,331,230
DXCM Vol: 11,133,392
FDS Vol: 1,192,775
WDAY Vol: 5,160,389
NOW Vol: 34,569,747

Top Losing Stocks

CTRA Vol: 73,319,495
GLW Vol: 17,221,470
COIN Vol: 14,429,129
F Vol: 108,272,348
MU Vol: 48,532,352