Is Invesco’s China Technology ETF Still A Buy After Trouncing The S&P 500 With 35% Run?

Photo of Michael Williams
By Michael Williams Published

Quick Read

  • CQQQ returned +34.92% YTD 2025 and outperformed the S&P 500 by 18.57 percentage points.

  • The ETF fell 32.68% over 5 years due to regulatory risks and geopolitical volatility.

  • Top holdings like PDD trade at low valuations (P/E of 11.57) but offer negligible dividend income.

  • The analyst who called NVIDIA in 2010 just named his top 10 AI stocks. Get them here FREE.

This post may contain links from our sponsors and affiliates, and Flywheel Publishing may receive compensation for actions taken through them.
Is Invesco’s China Technology ETF Still A Buy After Trouncing The S&P 500 With 35% Run?

© 24/7 Wall St.

China tech stocks spent much of 2024 and early 2025 under regulatory anxiety, trade tensions, and economic slowdown fears. Yet the Invesco China Technology ETF (NYSEARCA:CQQQ) has attracted investor attention despite ongoing volatility. The question now is whether CQQQ still serves a purpose in portfolios given its structural risks and opportunities.

A Tactical Play on Valuation Dislocation

CQQQ’s best portfolio role is as a tactical allocation for investors seeking undervalued tech exposure with meaningful geopolitical risk. The ETF tracks 163 Chinese technology companies across internet platforms, semiconductors, AI infrastructure, and consumer tech. Top holdings include Tencent, PDD Holdings, Meituan, and Baidu, companies trading at valuations that appear discounted compared to U.S. market peers. These companies generate substantial cash flow and operate at scale, but trade at discounts reflecting regulatory overhang, delisting fears, and capital flight concerns.

An infographic titled 'Invesco China Technology ETF (CQQQ): Tactical Exposure & Risks' with a dark green header. The infographic is divided into three sections. The first section, '1) HOW THE ETF WORKS' with a dark gray header and a world map graphic, details the ETF's tactical allocation to the Chinese technology sector, tracking 163 companies including internet platforms, AI, and semiconductors. It lists top holdings (Tencent, PDD Holdings, Meituan, Baidu), an expense ratio of 0.65%, and states returns are primarily driven by multiple expansion and sentiment shifts. The second section, '2) BEST USE CASE FOR INVESTORS' with an orange header and a balance scale graphic, describes its suitability as a tactical position for risk-tolerant investors seeking undervalued tech exposure and valuation-driven upside. It notes it's suitable for those willing to stomach significant volatility and regulatory risks, but NOT for income (negligible dividend yield) or conservative portfolios. The third section, '3) PROS & CONS,' features a dark gray header and is split into two columns. The left column, with a green header 'PROS,' lists four advantages using green double arrow icons: +34.92% YTD 2025 Performance (outperformed S&P 500 by +18.57 percentage points), exposure to undervalued companies with potential for rapid valuation snap-back, low P/E ratios for major holdings (e.g., PDD at 11.57), and low correlation to broader market (PDD Beta: 0.066). The right column, with a red header 'CONS,' lists five disadvantages using red downward arrow icons: significant structural volatility (-32.68% over 5 Years), high geopolitical and regulatory risks, heavy concentration risk (Top 10 Holdings nearly 30%), recent momentum slowing (+0.30% 1-Month), and no meaningful dividend income. A footer states 'Source Data as of Jan 1, 2026. Performance figures based on Dec 31, 2025 closing prices.' The overall color scheme includes green, orange, red, dark gray, and light beige.
24/7 Wall St.
This infographic provides a comprehensive overview of the Invesco China Technology ETF (CQQQ), detailing its operational mechanics, best use cases for investors, and a balanced view of its associated pros and cons. It highlights the ETF’s tactical nature, significant volatility, and geopolitical risks.

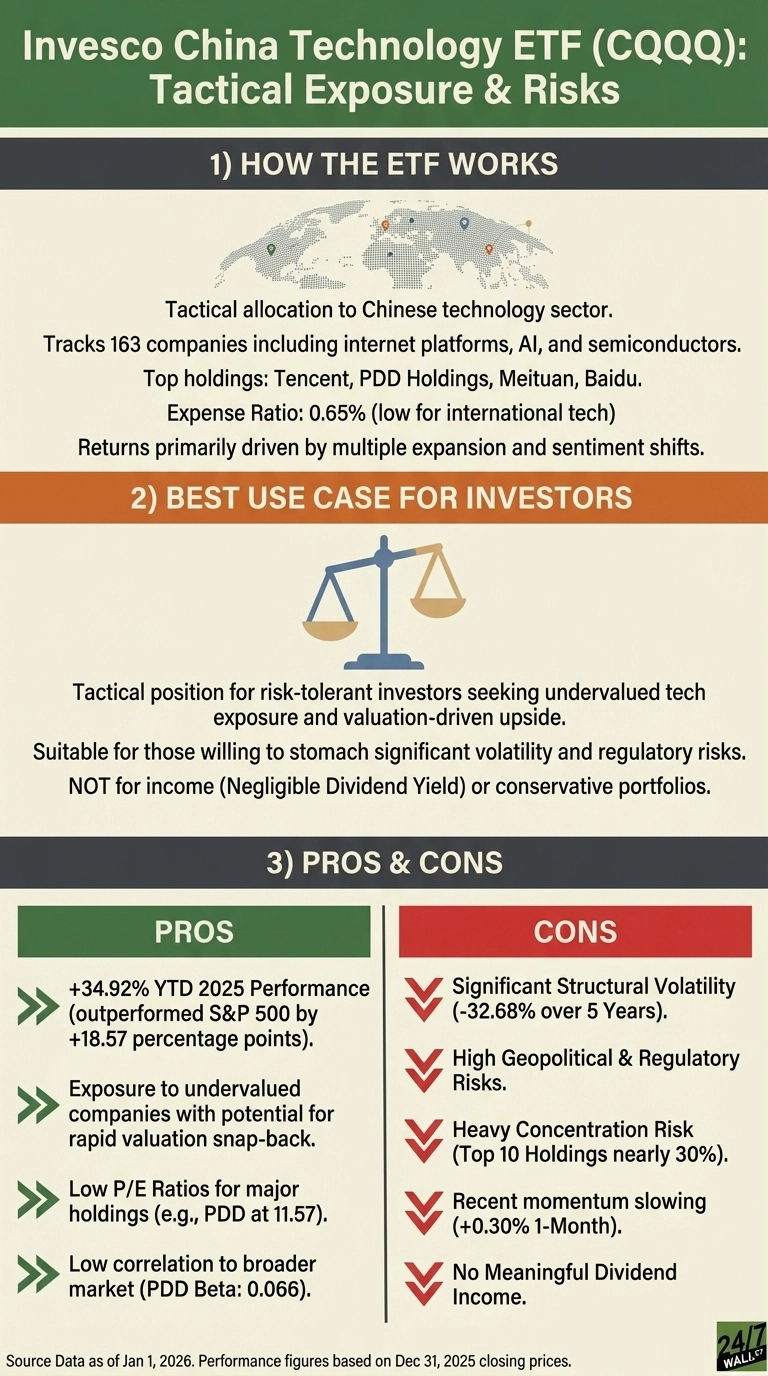
The return engine here is multiple expansion driven by sentiment shifts rather than explosive earnings growth. When regulatory and geopolitical anxieties ease, valuations can snap back quickly. The 0.65% expense ratio keeps costs reasonable for international exposure.

Performance Comes With Structural Volatility

CQQQ has experienced significant volatility over its history, with performance heavily influenced by factors beyond company fundamentals. The ETF remains well below its 2021 peak. This volatility stems from regulatory unpredictability, variable enforcement of data security laws, and ever-present U.S. delisting threats. Holdings are primarily Hong Kong-listed or ADRs, adding currency and jurisdictional complexity.

Geopolitical headlines can erase months of gains in days, regardless of underlying business quality. The ETF’s performance trajectory reflects the broader challenges facing Chinese technology investments in international portfolios.

Who Should Avoid This ETF

Income-focused investors should look elsewhere. CQQQ’s dividend yield is negligible, with annual distributions around $0.11 per share. This is a pure capital appreciation bet. Conservative investors or those nearing retirement should avoid CQQQ. The combination of geopolitical risk, regulatory uncertainty, and historical drawdowns makes it unsuitable for portfolios that cannot withstand 30% to 50% declines.

Consider KWEB for Concentrated Internet Exposure

The KraneShares CSI China Internet ETF (NYSEARCA:KWEB | KWEB Price Prediction) offers a similar but more focused alternative. KWEB concentrates heavily on internet and software companies, with Alibaba representing nearly 10% of the portfolio compared to CQQQ’s broader tech sector diversification. The tradeoff is a slightly higher 0.70% expense ratio and greater single-stock concentration risk. For investors who believe China’s internet platforms will lead any sustained rally, KWEB provides cleaner exposure to that thesis.

CQQQ works as a small, tactical position for risk-tolerant investors willing to stomach volatility in exchange for valuation-driven upside, but the geopolitical discount may never fully close.

Photo of Michael Williams
About the Author Michael Williams →

I am a long time investor and student of business, and believe finding good companies that can become great investments is the best game on earth. After 20 years of writing and researching the public markets it is clear that individuals have never had more tools and information to take control of their financial lives. From ETFs and $0 commissions to cryptos and prediction markets there has never been a greater democratization of access to investing. 

I write to help people understand the investments available to them so they can make the best choice for their portfolio, whether they're starting out or looking for income in retirement. 

Featured Reads

Our top personal finance-related articles today. Your wallet will thank you later.

Continue Reading

Top Gaining Stocks

ZBRA Vol: 2,879,381
HUM Vol: 2,904,415
CNC Vol: 9,427,268
ZBH Vol: 2,434,903

Top Losing Stocks

QCOM Vol: 38,596,346
CTRA Vol: 73,319,495
CZR Vol: 6,562,058
INTC Vol: 173,818,366
SWKS Vol: 7,019,097