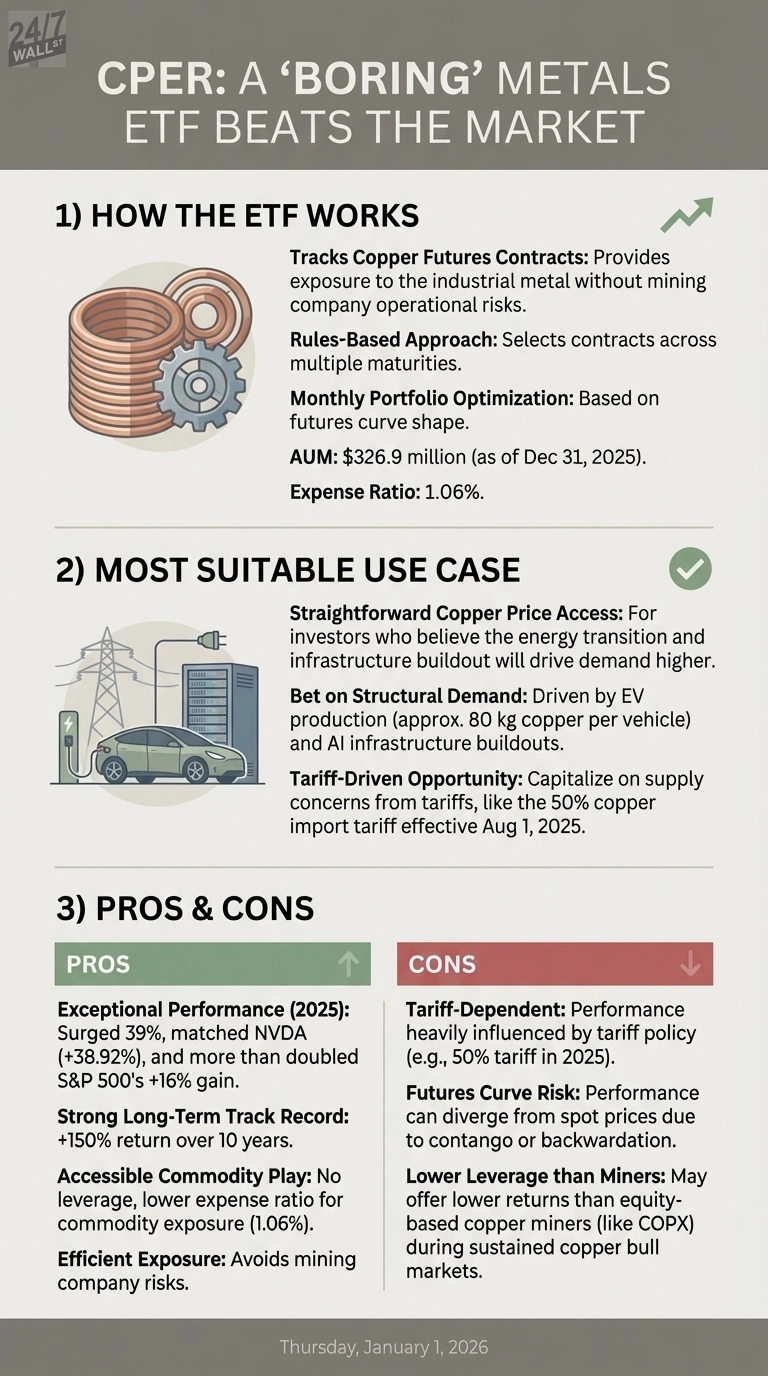
While investors chased artificial intelligence stocks and cryptocurrency throughout 2025, a commodity fund quietly delivered returns that rivaled the market’s biggest winners. The United States Commodity Index Funds Trust (NYSE:CPER) surged 39% last year, matching NVDA’s performance and more than doubling the S&P 500’s 16% gain.
CPER tracks copper futures contracts, providing exposure to the industrial metal without mining company operational risks. The fund uses a rules-based approach to select contracts across multiple maturities, optimizing its portfolio monthly based on the futures curve shape. With a 1.06% expense ratio and over $326 million in assets, it offers straightforward copper price access for investors who believe the energy transition and infrastructure buildout will drive demand higher.
The Tariff Factor That Changed Everything
Copper prices accelerated dramatically in the second half of 2025 after the administration implemented a 50% tariff on copper imports effective August 1. The July announcement sent shockwaves through commodity markets as traders priced in potential supply constraints. CPER gained 8.3% in December alone while the Nasdaq 100 ETF declined 0.5%.
Tariff policy remains the dominant macro factor for copper. Any modification to import duties, expansion to additional countries, or retaliatory trade measures could swing prices substantially. The London Metal Exchange copper price provides the clearest signal of evolving supply and demand dynamics. Investors should monitor monthly U.S. Census Bureau trade data to track whether domestic production is filling the gap left by reduced imports or whether supply tightness is worsening.
Where Demand Meets Reality
The micro story for CPER centers on physical copper demand from two accelerating trends: electric vehicle production and data center construction. EVs require approximately 80 kilograms of copper per vehicle, roughly four times more than traditional cars. Meanwhile, artificial intelligence infrastructure buildouts demand massive copper amounts for power distribution and cooling systems. JPMorgan projects copper prices could average $12,500 per metric ton through the first half of 2026, citing these structural demand drivers.
Investors should review CPER’s monthly fact sheet on the USCF Investments website to track how the fund’s futures positioning changes as market conditions evolve. The fund’s performance can diverge from spot copper prices based on contango or backwardation in the futures curve, making the specific contracts held more important than many realize.
Consider the Mining Alternative
For investors seeking copper exposure with potentially higher returns, Global X Copper Miners ETF (NYSEARCA:COPX) offers an equity-based approach. COPX holds shares of copper mining companies rather than futures contracts, providing operational leverage to copper prices. When copper rallies, miners typically see profit margins expand faster than the underlying commodity moves. The tradeoff is higher volatility and company-specific risks like labor disputes, permitting delays, and capital allocation decisions. COPX charges a lower 0.65% expense ratio and may outperform during sustained copper bull markets.
The Year Ahead
CPER’s 2026 performance will hinge on whether tariff-induced supply constraints persist and whether EV and infrastructure demand meets optimistic forecasts. Watch trade policy announcements and monthly LME copper inventory levels for the clearest signals of where prices head next.
Contact [email protected] for any questions or corrections.