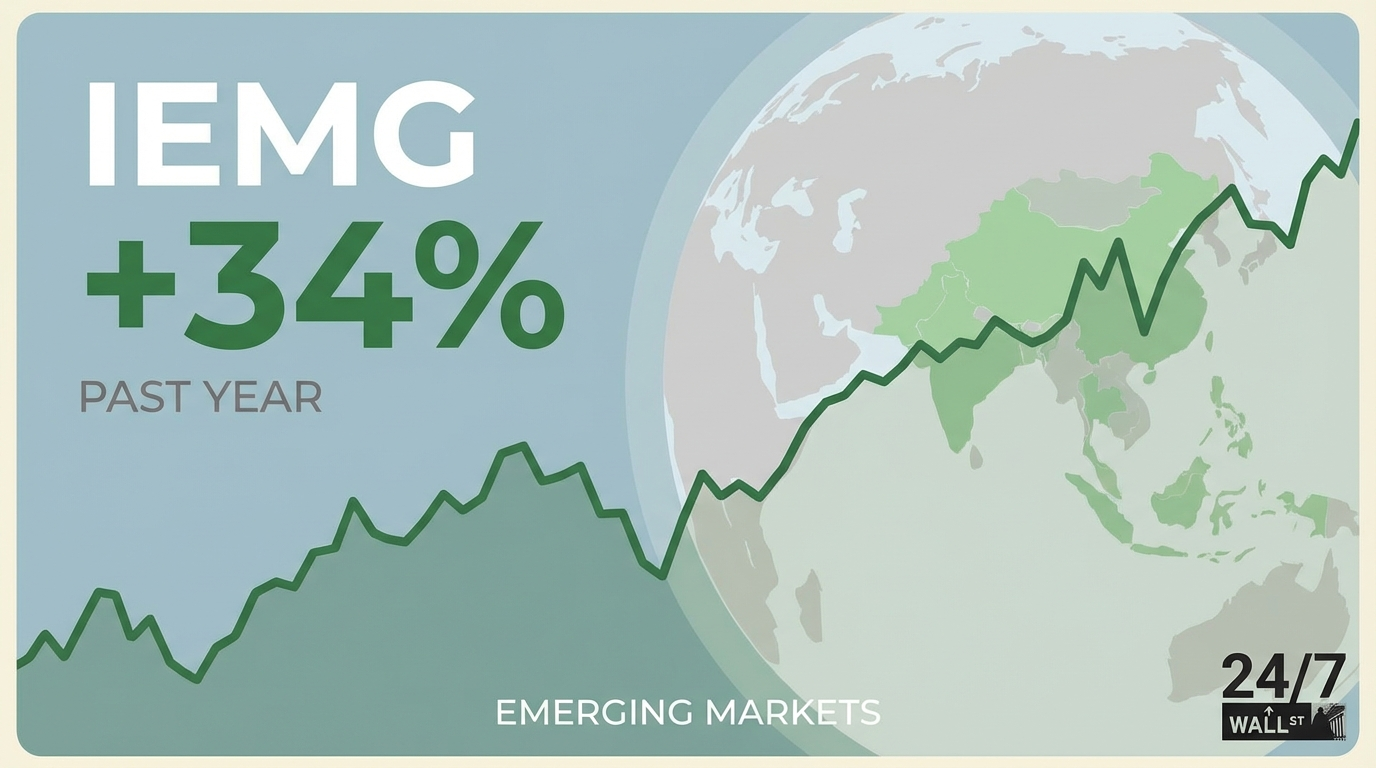
The iShares Core MSCI Emerging Markets ETF (NYSEARCA:IEMG) delivered a 34% return over the past year, crushing the S&P 500’s 18% gain and drawing billions in fresh capital. But after such a run, is this still a buy, or have the easy gains been captured?
With $117 billion in assets and a 0.09% expense ratio, IEMG tracks small, mid, and large-cap stocks across developing economies, with heavy concentration in China and Taiwan (nearly 48% combined), plus meaningful allocations to India, South Korea, Saudi Arabia, and Brazil. Recent performance was driven by a weakening dollar, improving emerging market fundamentals, and strong demand for semiconductors that dominate the fund’s tech-heavy portfolio.

The Dollar’s Direction Matters More Than You Think
Currency moves are the biggest macro factor determining IEMG’s 2026 performance. When the dollar weakens, emerging market assets become more attractive: local currency gains translate into larger dollar returns, and dollar-denominated debt becomes easier to service, improving financial stability.
The dollar declined roughly 10% in 2025, providing a powerful tailwind. Currency strategists expect this weakness to continue into 2026, driven by narrowing interest rate differentials as the Federal Reserve maintains lower rates. Franklin Templeton’s 2026 outlook explicitly calls for further dollar weakness, noting the currency remains overvalued against most G10 and emerging market peers.
Watch the Dollar Index (DXY), which measures the greenback against major currencies and typically moves inversely to emerging market performance. A sustained move below 100 would signal continued support for IEMG, while a rally above 105 could create headwinds. Check the index weekly, particularly during Federal Reserve meetings and major economic data releases.
China Exposure Is Both the Opportunity and the Risk
IEMG’s substantial China allocation is the key fund-specific factor to monitor. China represents roughly 25-30% of the portfolio through holdings like Tencent, PDD Holdings, and state-owned enterprises. Taiwan adds another 15-20%, dominated by TSMC and other tech manufacturers.
This concentration creates a high-beta bet on the Chinese economy and U.S.-China relations. When China’s stimulus measures boost confidence or trade tensions ease, IEMG surges. When geopolitical friction intensifies or Chinese growth disappoints, the fund suffers disproportionately. The top holding alone accounts for over 10% of assets, meaning single-stock risk is material.
Monitor this through BlackRock’s monthly fact sheets on the iShares website, which break down country allocations and top holdings. If China’s weight creeps above 30% or a single holding exceeds 12%, the risk profile is shifting meaningfully. Watch Chinese economic indicators like the official manufacturing PMI (released monthly) and retail sales data.
Consider EMXC for Lower China Concentration
For investors attracted to emerging markets but concerned about China risk, the iShares MSCI Emerging Markets ex China ETF (NASDAQ:EMXC) offers an alternative. With $13.1 billion in assets and a 0.25% expense ratio, EMXC provides similar exposure while completely excluding Chinese companies.
EMXC overweights India, Taiwan, South Korea, and Brazil to fill the gap. Its top holding is a massive 16.2% allocation (likely Taiwan Semiconductor), compared to IEMG’s more diversified approach. This creates heavier semiconductor exposure but eliminates concerns about Chinese regulatory crackdowns, U.S.-China tensions, or property sector contagion.
EMXC has underperformed IEMG recently as China’s stimulus-driven rally boosted the broader index, but it offers a cleaner bet on non-China emerging market growth. The higher expense ratio (0.25% vs. 0.09%) costs about $16 annually per $10,000 invested.
The Verdict
Over the next 12 months, IEMG’s performance hinges on dollar weakness continuing (the macro factor) and China’s economy stabilizing without major geopolitical disruptions (the micro factor). Both trends appear favorable entering 2026, but the 34% run means much of the easy money has been made, and volatility will likely increase as valuations normalize.