
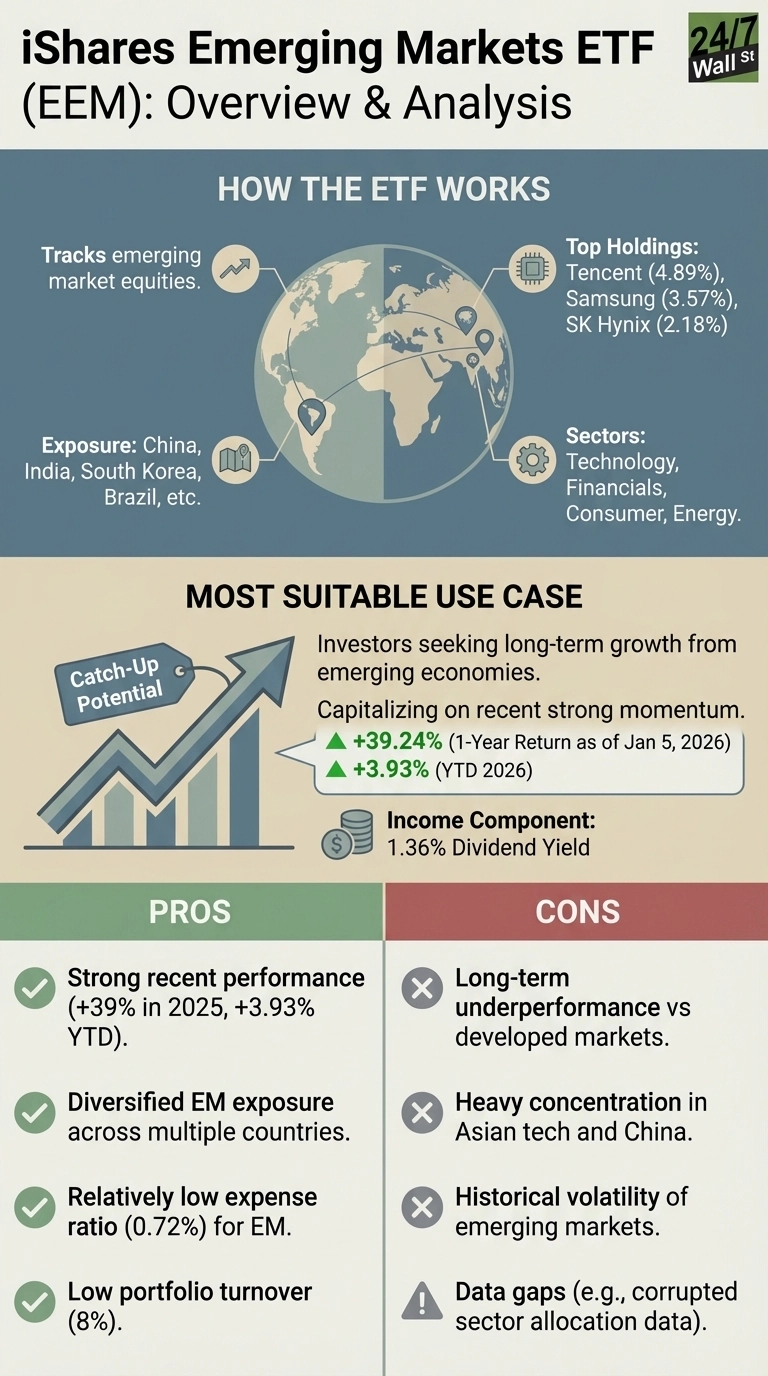
The iShares MSCI Emerging Markets ETF (NYSE:EEM) surged 39% in 2025 and added another 3.9% in the first week of 2026. The structural headwinds that kept emerging markets out of favor may finally be reversing.
JPMorgan projects up to $50 billion flowing into emerging debt funds in 2026, while Morgan Stanley and Bank of America upgraded their outlook on the asset class. According to InvestmentNews, 2025 marked the best capital rush into emerging market securities since 2009. BofA’s head of emerging fixed income declared that EM bears have gone extinct.
The Dollar Factor: Why Currency Shifts Matter More Than You Think
The biggest macro driver for EEM in 2026 will be the U.S. dollar. After posting its sharpest annual decline in eight years during 2025, the dollar is forecast to weaken further through mid-2026. When the dollar weakens, EM stocks and bonds become more attractive to global investors, and local currency debt delivers better returns.
Morgan Stanley expects the dollar decline to continue into mid-2026, creating a tailwind for funds like EEM. China’s iShares China Large-Cap ETF (NYSE:FXI) jumped 34% over the past year, and Brazil’s iShares MSCI Brazil ETF (NYSE:EWZ) rocketed 54%. Those gains came during the dollar’s 2025 slide, and if the pattern holds, EEM’s heavy China exposure could drive similar outperformance.
Watch the U.S. Dollar Index (DXY) weekly. When it trends below 100, emerging markets historically perform well. If the Fed continues cutting rates in 2026, that should keep dollar weakness intact and support EM flows.
What’s Inside EEM: China Exposure and the Recovery Bet
EEM’s performance hinges on China, which represents roughly a quarter of the fund’s allocation. Top holdings: Tencent at 4.9%, Samsung at 3.6%, and SK Hynix at 2.2%. Indian banks like HDFC and Reliance Industries add another 2.5%.
The China component is critical. FXI gained 4.3% year-to-date in 2026, outpacing its monthly and weekly gains. That acceleration suggests Chinese equities are building momentum after years of stagnation. Franklin Templeton projects 15% earnings growth for MSCI China in 2026, with the consumer discretionary sector expected to grow 35%.
But there’s a catch. FXI is essentially flat over five years, down 0.4%. The recent rally could be the start of a multi-year catch-up trade, or another false start. For EEM investors, the answer will determine whether 2026 delivers on the bullish forecasts.
Monitor EEM’s monthly fact sheet on the iShares website. Pay attention to country allocation shifts and whether China’s weight is increasing. Watch quarterly earnings reports from Tencent and Samsung, which together represent over 8% of the portfolio.
A Cheaper Alternative: IEMG
The iShares Core MSCI Emerging Markets ETF (NYSE:IEMG) tracks a similar index but charges just 0.09% annually compared to EEM’s 0.72%. That’s an 87% cost savings. IEMG also has $117 billion in assets versus EEM’s $20.6 billion, providing deeper liquidity and tighter bid-ask spreads.
The holdings are nearly identical. The main difference is that IEMG includes more small and mid-cap exposure. Over 20 years, that 0.63% annual fee difference is equivalent to an extra 13% in your pocket.
The Bottom Line
The most important macro factor for EEM in 2026 is dollar weakness extending through mid-year, and the most important micro signal is whether China’s earnings growth accelerates above 15% as forecasted. If both happen, EEM could repeat or exceed its 2025 performance. If either falters, the rally could stall quickly.
Contact [email protected] for any questions or corrections.