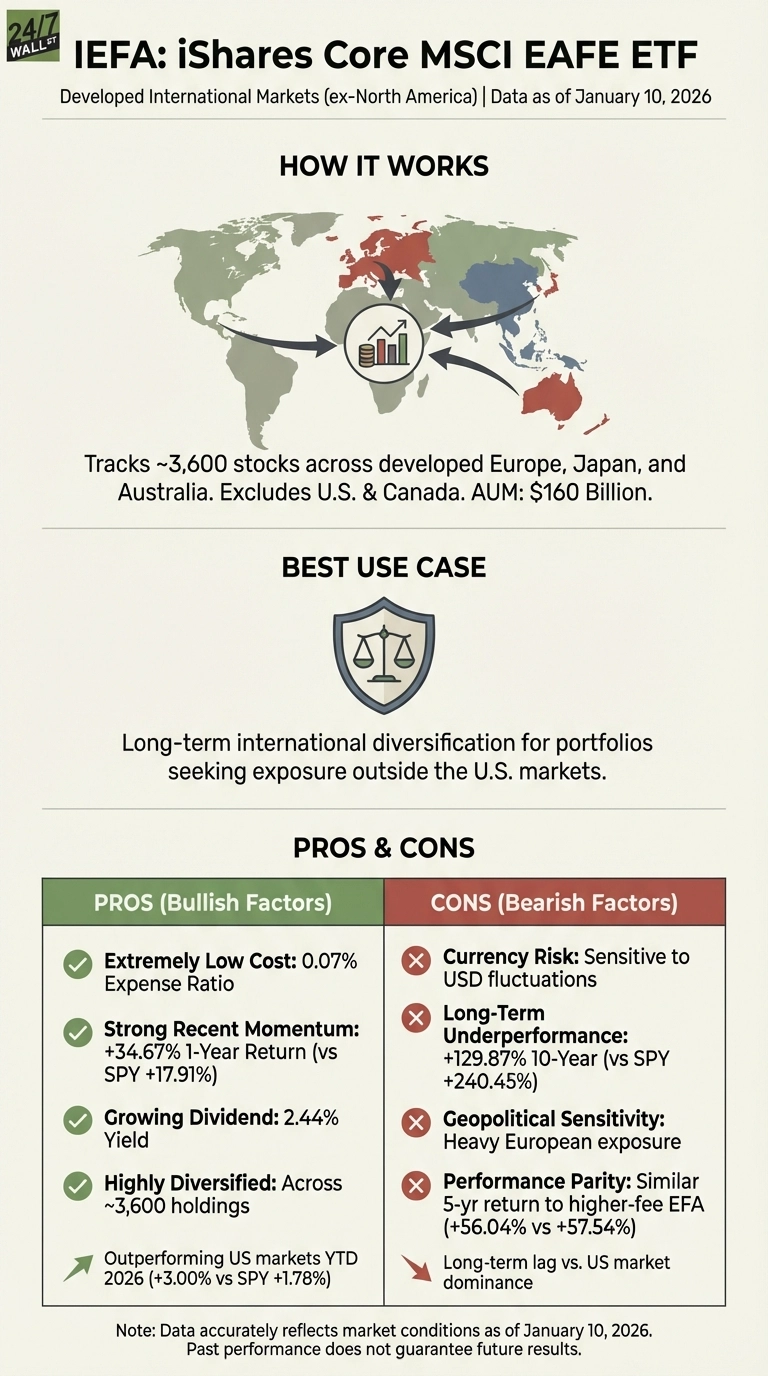
The iShares Core MSCI EAFE ETF (NYSEARCA:IEFA) tracks developed markets across Europe, Japan, and Australia, offering exposure to roughly 3,600 stocks outside North America. With $160 billion in assets and a 0.07% expense ratio, it’s the go-to choice for international diversification. After years of lagging U.S. markets, IEFA delivered a 35% gain over the past year, nearly doubling the S&P 500’s return. The fund is up 3% year-to-date in 2026.
International stocks face different pressures than domestic equities. Understanding what drives IEFA’s returns helps determine whether this rally has legs or if headwinds are building.
The Dollar Will Make or Break Your Returns
Currency movements are the biggest macro factor affecting IEFA in 2026. When you own this ETF, you’re betting on the euro, yen, pound, and Australian dollar against the U.S. dollar. If the dollar strengthens, your returns get squeezed even when underlying stocks perform well.
J.P. Morgan analysis suggests the dollar could weaken early in 2026 before rebounding in the second half as rate cuts take hold in Europe. A weaker dollar boosts returns when foreign earnings translate back into dollars. Dollar strength creates a headwind that can turn a winning year abroad into a losing one at home.
Watch the DXY dollar index weekly. Major moves above 105 historically pressure international returns, while readings below 100 support them. Federal Reserve policy statements and European Central Bank rate decisions are your early warning system. When rate differentials narrow between the U.S. and Europe or Japan, the dollar typically weakens, benefiting IEFA holders.
Valuation and Sector Mix Matter More Than Ever
IEFA’s composition creates both opportunity and risk. Top holdings include ASML Holding (NASDAQ:ASML | ASML Price Prediction), SAP SE (NYSE:SAP), AstraZeneca PLC (NASDAQ:AZN), and Nestle, representing a heavy tilt toward pharmaceuticals, industrials, and financials. Technology accounts for a much smaller slice than in U.S. funds, explaining both the decade-long underperformance and the recent catch-up rally as investors rotate into value-oriented sectors.
The fund’s valuation advantage over U.S. markets is significant. European and Japanese stocks trade at lower price-to-earnings multiples, offering more room for multiple expansion if economic growth accelerates. But IEFA is more sensitive to cyclical downturns. The fund’s 25% financial sector weighting makes it vulnerable to credit stress or banking sector weakness.
Check BlackRock’s monthly fact sheet for holdings updates and sector shifts. The prospectus and MSCI EAFE index methodology documents on MSCI’s website detail reconstitution schedules, typically in May and November, when sector weights can shift meaningfully.
Consider SCHF for Lower Costs
The Schwab International Equity ETF (NYSEARCA:SCHF) offers a compelling alternative. With a 0.03% expense ratio compared to IEFA’s 0.07%, it’s nearly 60% cheaper. SCHF pays a 2.36% dividend yield versus IEFA’s 2.44%. The fund holds similar top positions including ASML, Samsung, and Roche, with $53.5 billion in assets providing ample liquidity.
The main tradeoff is breadth. IEFA covers more countries and includes small-cap stocks, while SCHF focuses on large and mid-caps. For cost-conscious investors who don’t need small-cap exposure, SCHF’s lower fee could add meaningful savings over time, especially in tax-advantaged accounts.
The Bottom Line
Dollar weakness and attractive valuations in Europe and Japan could drive IEFA higher in 2026, but currency headwinds and cyclical sector exposure remain the primary risks to watch.
Contact [email protected] for any questions or corrections.