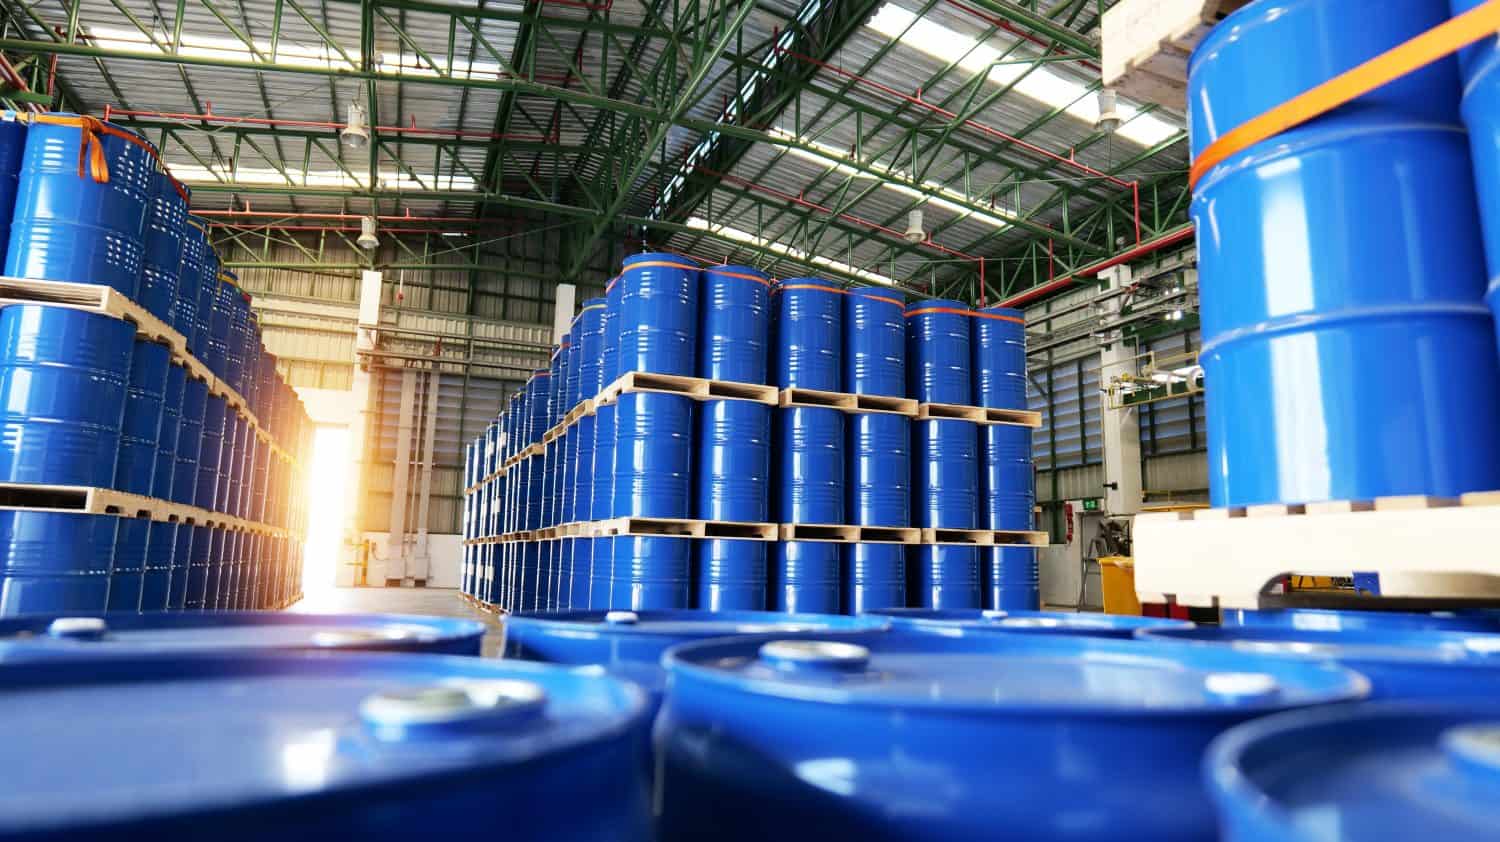
Materials companies operate at the front end of nearly every supply chain. When construction picks up, steel and cement move. When factories expand, they need chemicals and gases. When consumer spending rises, packaging demand follows. The Materials Select Sector SPDR Fund (NYSEARCA:XLB) gives investors exposure to this cyclical sector through a single, low-cost vehicle.
Pure Cyclical Exposure Without the Diversification
XLB serves one specific role: concentrated exposure to materials companies. With 94.4% of assets in the materials sector and virtually nothing elsewhere, this is not a diversified holding. It’s a targeted bet on economic activity.
The fund’s structure reveals its concentrated nature through its largest holding. Linde (NYSE:LIN) dominates the portfolio at 13.42%, representing exposure to industrial gases that serve manufacturing and healthcare sectors globally. Below Linde sit mining giants like Newmont (NYSE:NEM) and Freeport-McMoRan (NYSE:FCX), which tie the fund’s performance directly to commodity price movements. This top-heavy structure means a handful of companies drive most returns.
The return engine here is straightforward: when demand for raw materials, chemicals, and building products strengthens, these companies generate higher revenue and margins. When demand softens, the opposite occurs. There are no derivatives or options strategies complicating the structure. You own a basket of materials companies, and their collective performance drives your returns.
Recent Performance Shows the Cyclical Pattern
Recent performance demonstrates the cyclical pattern clearly. The fund has delivered strong double-digit returns over the past year, driven by infrastructure spending and stable commodity prices that boosted materials demand. When economic conditions favor industrial activity and construction, materials companies capture that momentum through higher volumes and improved pricing power.
This outperformance reflects a period where materials benefited from infrastructure spending, stable commodity prices, and industrial demand. But that’s the nature of cyclical sectors. They can lead during expansions and lag during contractions.
What You’re Trading Off
Owning XLB means accepting three specific tradeoffs. First, you get zero sector diversification. If materials underperform, your entire position underperforms. Second, the fund’s returns correlate heavily with commodity prices and industrial activity. When oil prices rise or construction slows, margins compress across the portfolio.
Third, concentration risk matters. Linde’s performance alone can materially impact the fund since it represents more than one in every eight dollars invested. This top-heavy structure amplifies both gains and losses from the fund’s largest positions.
XLB works best as a tactical position for investors who want materials exposure without picking individual stocks, or who believe the economic cycle favors this sector over the next few quarters. It’s not a core holding for most portfolios, but it can serve as a targeted play when conditions align.