Will Social Security Really Run Out of Money? What Happens Then?
Social Security faces a financial crossroads that is closer than many Americans realize. The retirement program will not actually "run out of money" since current workers will always pay into the system. But unless something changes, there will not be…


Social Security faces a financial crossroads that is closer than many Americans realize. The retirement program will not actually “run out of money,” since current workers will always pay into the system. But unless something changes, there will not be enough funds to cover benefits at their current rates.
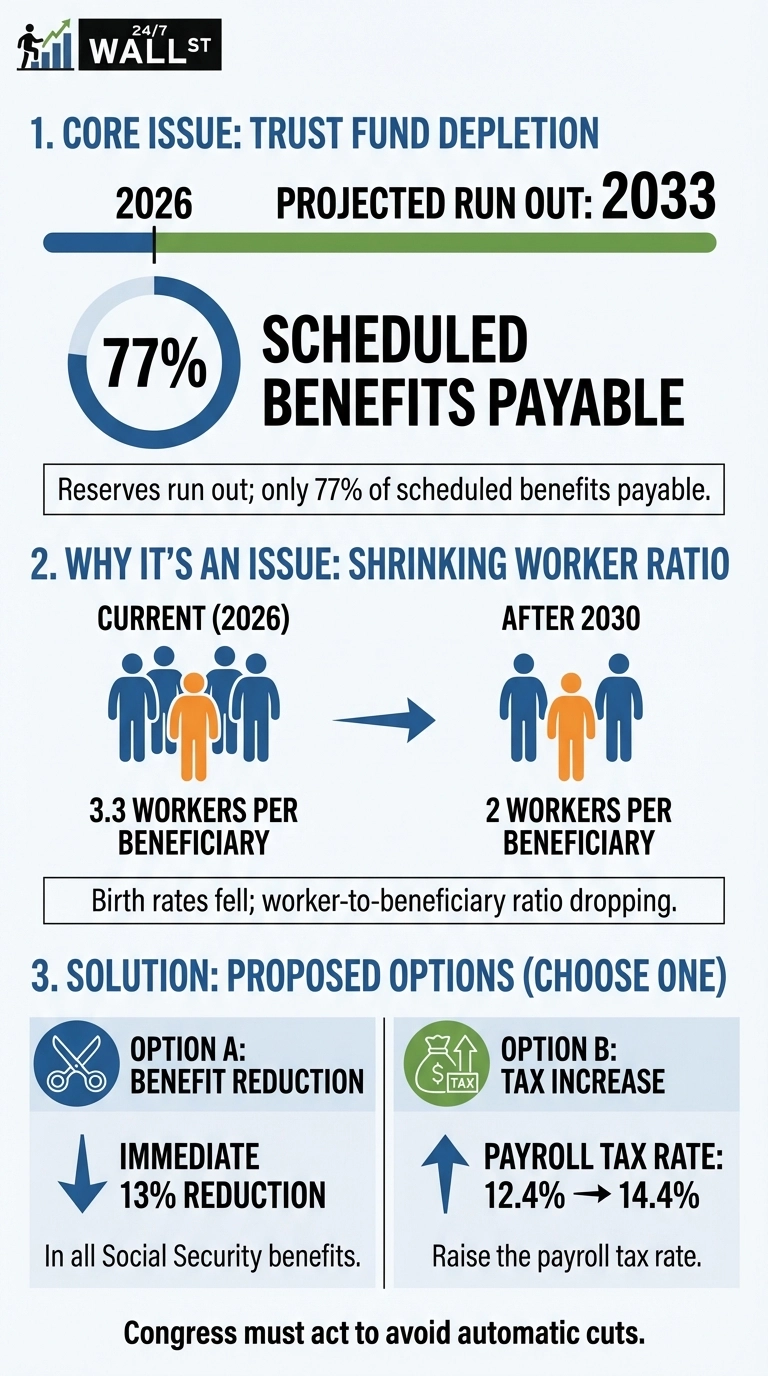
The program’s Old-Age and Survivors Insurance Trust Fund is now projected to exhaust its reserves by the fourth quarter of 2032, at which point the system will only be able to pay 78% of scheduled benefits from incoming payroll tax revenue. That depletion date moved up one year from the prior projection, driven largely by the One Big Beautiful Bill Act signed in July 2025, which expanded income tax deductions for seniors and reduced the revenue flowing to the trust funds by nearly $170 billion over the coming decade. The Social Security Fairness Act, enacted in January 2025, added further costs by eliminating two provisions that had reduced benefits for certain public-sector retirees. Together, these two pieces of legislation have drained reserves faster than anticipated. More than 70 million Americans currently receiving benefits face automatic cuts within the next six years unless Congress acts.
Why Social Security Is Running Short
The fundamental challenge is not longevity. It is demographics. Birth rates collapsed after the baby boom, and the 2026 Trustees Report lowered the projected U.S. fertility rate to just 1.75 children per woman, down from earlier estimates of 1.9. That shrinking pipeline of future workers puts direct pressure on a pay-as-you-go system. The worker-to-beneficiary ratio has already fallen to roughly 2.9 workers supporting each beneficiary today, down from more than five-to-one in 1960, and is projected to fall further to about 2.2-to-one by the 2070s. The math that once made Social Security sustainable is deteriorating with each passing year.
The trust fund’s depletion reflects a widening gap between what the program collects and what it pays out. Benefit payments are growing faster because more Americans are retiring and claiming benefits while the worker base supporting them shrinks. The country is also in what demographers call “Peak 65,” a period running from 2024 through 2027 in which more than 4.1 million Americans turn 65 each year, the largest retirement surge in U.S. history. That wave is accelerating the drawdown. The 75-year actuarial shortfall now stands at approximately $30.3 trillion, up from $26 trillion in the prior year’s report, signaling that delay is only making the eventual fix more expensive.
What Happens When the Trust Fund Runs Dry
Many people misunderstand what insolvency actually means. Social Security will not disappear. It will continue collecting payroll taxes from current workers. But without reserves to draw from, benefits must match incoming revenue. That creates an immediate shortfall with real financial consequences for retirees. Under the 2026 Trustees Report’s projections, a 22% across-the-board benefit cut would take effect automatically. For a typical dual-earning couple retiring around the time of trust fund depletion, that translates to roughly $16,900 in lost annual benefits, according to the Committee for a Responsible Federal Budget. A single-income couple would lose about $12,700 per year, while high-income couples could see cuts as large as $22,300. Crucially, even though low-income couples lose a smaller dollar amount, those cuts represent a far larger share of their total income.
Potential Solutions on the Table
Congress faces difficult choices to restore solvency, each with significant trade-offs. The most direct approaches would require either immediate sacrifice from current beneficiaries or higher taxes on current workers. A benefit reduction or a payroll tax increase from the current rate of 12.4% would each maintain full payments for 75 years, according to some estimates, though neither path is politically simple. A reform package might meet in the middle, asking both sides to absorb part of the adjustment. Other proposals include raising the income cap on payroll taxes, which currently applies only to wages up to $184,500, gradually increasing the full retirement age beyond 67, or means-testing benefits for higher earners.
The United States still has time to act, though that window is closing fast. Unlike many countries facing similar pressures, annual trustee projections give lawmakers an early warning system, allowing gradual changes that give affected generations time to adjust retirement plans. The political challenge is severe: any bipartisan solution would need to clear the Senate’s filibuster, and analysts note that meaningful compromise has proven elusive for decades. The last time Congress restructured Social Security’s financing was 1983. The question now is whether lawmakers can summon the same resolve before automatic cuts arrive in 2032.
Editor’s note: This article has been updated to reflect the 2026 Social Security Trustees Report, published June 9, 2026, which moved the OASI trust fund depletion date to the fourth quarter of 2032 (from 2033), revised the payable benefit share at depletion to 78%, and updated the projected annual benefit loss for a typical retiring couple to approximately $16,900, per analysis by the Committee for a Responsible Federal Budget. The 75-year actuarial shortfall figure of $30.3 trillion and the revised fertility rate projection of 1.75 children per woman are also drawn from the 2026 report cycle.
Contact [email protected] for any questions or corrections.
Austin Smith is a financial publisher with over two decades of experience as an investor, analyst, and advisor. He covers stocks, ETFs, Artificial intelligence and personal finance for 24/7 Wall St. Previously, he spent over a decade at The Motley Fool as a senior editor for Fool.com, portfolio advisor for Millionacres, and launched The Ascent to help reader take control of their personal finances.
His work has been featured on Fool.com, NPR, CNBC, USA Today, Yahoo Finance, MSN, AOL, Marketwatch, and many other publications. He is as an advisor to private companies, and co-hosts The AI Investor Podcast with Eric Bleeker.
When not looking for investment opportunities, he can be found skiing, running, or playing soccer with his children. Learn more about Austin's investment approach here.