Newmont’s (NYSE: NEM) Q4 report can be seen as a test of whether record gold prices could drive margin expansion despite lower production volumes. The company delivered adjusted EPS of $2.52, crushing the $1.97 consensus by 27.9%. Shares traded at $125.40, essentially flat, after the report. The muted reaction suggests investors are digesting a complex story: stellar cash generation offset by declining 2026 production guidance.
Gold Prices Carried the Quarter
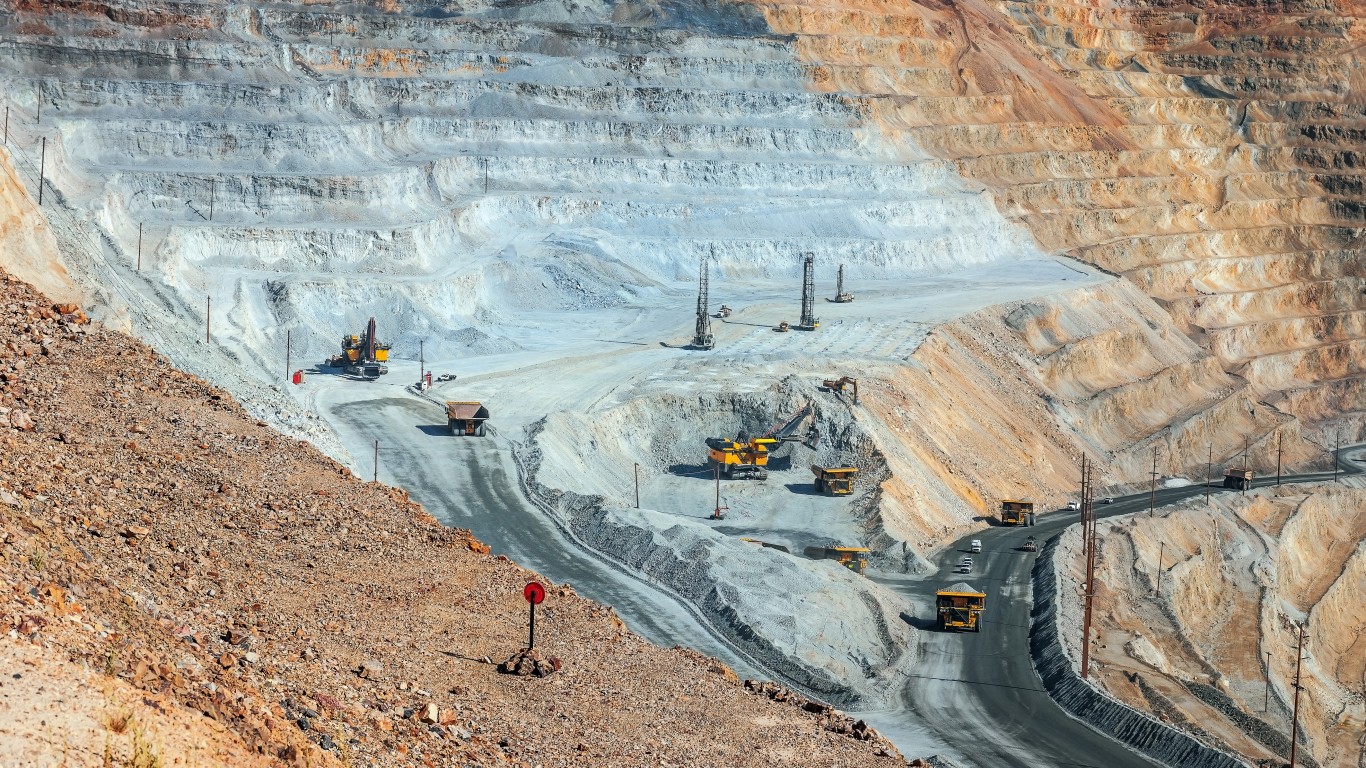
The earnings beat came entirely from commodity prices, not operational outperformance. Newmont realized $4,216 per ounce in Q4, up $1,573 year-over-year. That 59.5% price surge more than compensated for attributable production of 1,453 thousand ounces, down 23.4% from 1,899 thousand ounces in Q4 2024. Revenue climbed 20.6% to $6.82 billion, but the real story was free cash flow: $2.8 billion in the quarter and $7.3 billion for the full year, up 71.9% year-over-year.
All-in sustaining costs held at $1,302 per ounce in Q4, giving Newmont a roughly $2,914 per ounce margin at current prices. That explains why the company generated record cash despite producing less gold. Management used the windfall to slash $3.4 billion in debt and return $3.4 billion to shareholders through buybacks and dividends. The balance sheet now shows a $2.1 billion net cash position, a dramatic reversal from prior leverage concerns.
Production Guidance Creates Uncertainty
The cautious market response likely stems from 2026 guidance. Newmont expects roughly 5.3 million ounces of production, down 10.2% from 5.9 million in 2025. All-in sustaining costs are projected at $1,680 per ounce, up from $1,358 for full-year 2025. CEO Natascha Viljoen emphasized that “we are entering 2026 with a clear focus on continuing to drive margin expansion and generate robust free cash flow,” but lower volumes and higher unit costs create margin pressure if gold retreats from current levels.
Near-term headwinds include a 60,000-ounce Q1 impact from bushfire damage at Boddington and expired tax stability agreements in Ghana that could add roughly $50 per ounce to costs. The company also took a $779 million impairment on the indefinitely deferred Yanacocha Sulfides project.
What Gold Investors Should Watch
The stock’s year-to-date gain of 25.6% has outpaced the SPDR Gold Shares (NYSE: GLD) 16.0% rise, reflecting operational leverage to gold prices. With the metal trading near $4,300 to $4,400 per ounce at year-end 2025, Newmont’s margins remain robust despite production challenges. The enhanced capital allocation framework includes a $1.1 billion annual dividend commitment and $2.4 billion remaining under a $6 billion buyback authorization.
Investors will want to continue tracking whether 2026 cost guidance holds and how quickly projects like Tanami Expansion 2 can reverse the production decline trajectory.