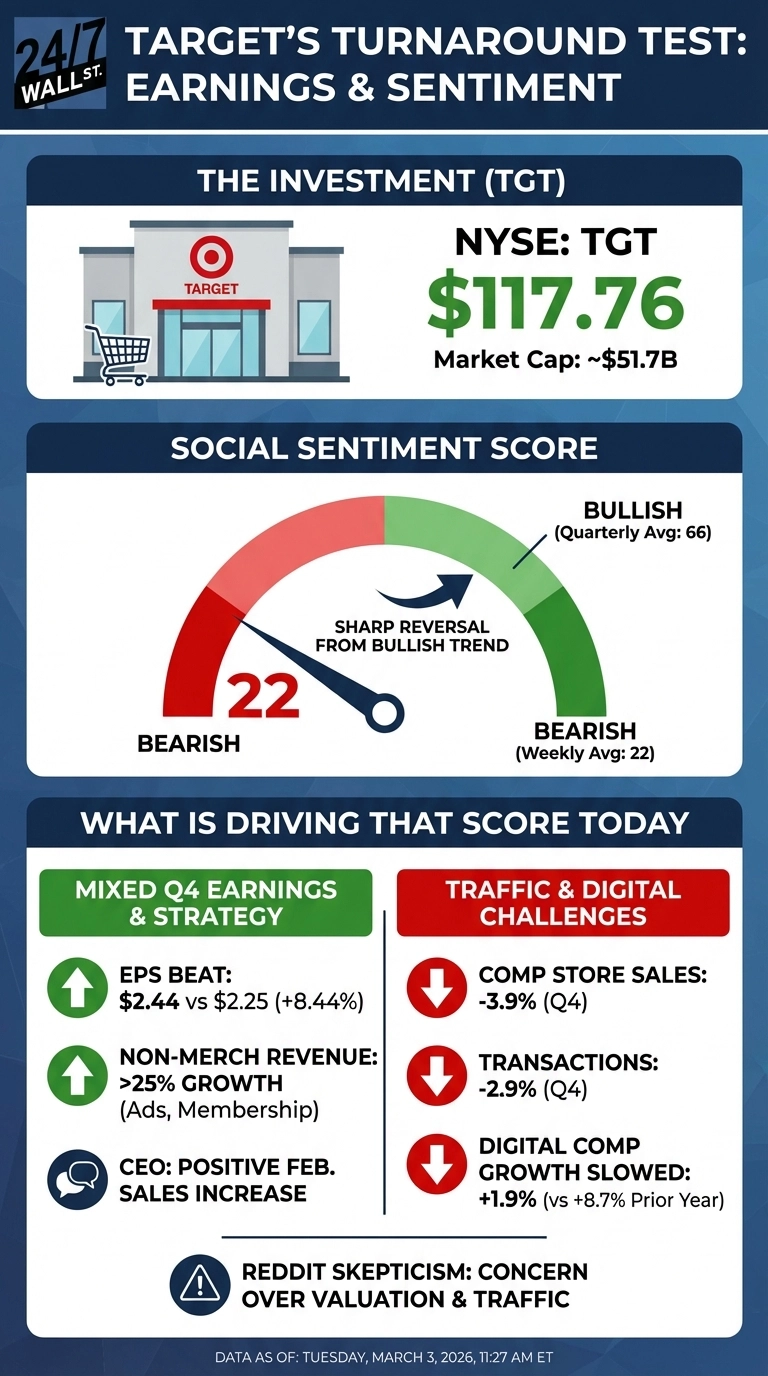
If you have been wondering when Target Corporation might start to see a turnaround after a few negative quarters, the company (NYSE:TGT) reported Q4 fiscal 2026 earnings this morning, and the headline EPS beat is real but incomplete. Target beat adjusted EPS estimates by 8.44%, posting $2.44 against a $2.16 consensus, all while revenue came in at $30.45B, in line with estimates but down 1.49% year-over-year. Reddit sentiment tells a similar story: quarterly scores averaged a bullish 65.69 over the past three months, but this week the score collapsed to 22, firmly bearish. The stock is up 21.06% year-to-date entering today.
The EPS Beat and the Traffic Problem Coexist
Ultimately, Target’s earnings beat was driven by margin improvement and high-margin non-merchandise revenue, not necessarily foot traffic recovery. In addition, gross margin expanded by 40 basis points to 26.6%, driven by lower inventory shrinkage and supply chain costs. Roundel, Target’s retail advertising network, generated $295M in Q4 with double-digit growth, and membership revenue more than doubled year-over-year.
On the other side of the coin, comparable store sales fell 3.9%, transactions declined 2.9%, and digital comparable sales growth decelerated to 1.9% from 8.7% the prior year. Full-year free cash flow dropped 36.66% to $2.84B. CEO Michael Fiddelke noted that “Target saw a healthy, positive sales increase in February,” though cautioned that one month does not make a trend. Target’s heavy exposure to apparel and home furnishings makes it more vulnerable than peers focused on consumables, particularly with the University of Michigan Consumer Sentiment Index sitting at 56.4, averaging just 55.5 over the past 12 months.
Reddit Is Skeptical, and the Valuation Question Is Central
Reddit discussion is low-volume but consistently bearish, concentrated in r/options and r/stocks. A post in r/stocks titled “What’s with all the absurd PE ratios?” captures the skepticism retail traders are applying to Target right now. The post, which drew 200 upvotes and 139 comments, opens with the question:
“What’s with all the absurd PE ratios?” — u/unknown on r/stocks
– a sentiment that cuts directly to the concern retail investors have about whether Target’s current valuation is justified, given its traffic declines and slowing digital growth.
Target trades at a forward P/E of roughly 14x, with an analyst consensus price target of $107.28, well below the current price of $117.17. The analyst community is split: 24 analysts rate it Hold, 10 recommend a buy, while another 4 rate it Strong Sell, and the price target range spans from $63 to $140. Given this variance, it’s fair to say that the bearish case rests on three concerns:
- Comparable store sales have declined for multiple consecutive quarters, with transactions falling 2.9% in Q4.
- Digital comparable sales growth decelerated from 8.7% to 1.9% year-over-year.
- Operating income fell 5.93% year-over-year, and no shares were repurchased in Q4 despite $8.3B in remaining buyback capacity.
On the plus side, Target’s FY2027 guidance calls for approximately 2% net sales growth and full-year EPS of $7.50 to $8.50. The February sales uptick is the most tangible near-term signal to watch, and if Q1 comparable sales confirm that momentum, the Reddit sentiment reversal may prove premature. If traffic keeps softening, advertising and membership revenue cannot compensate for a shrinking core retail business at this scale.