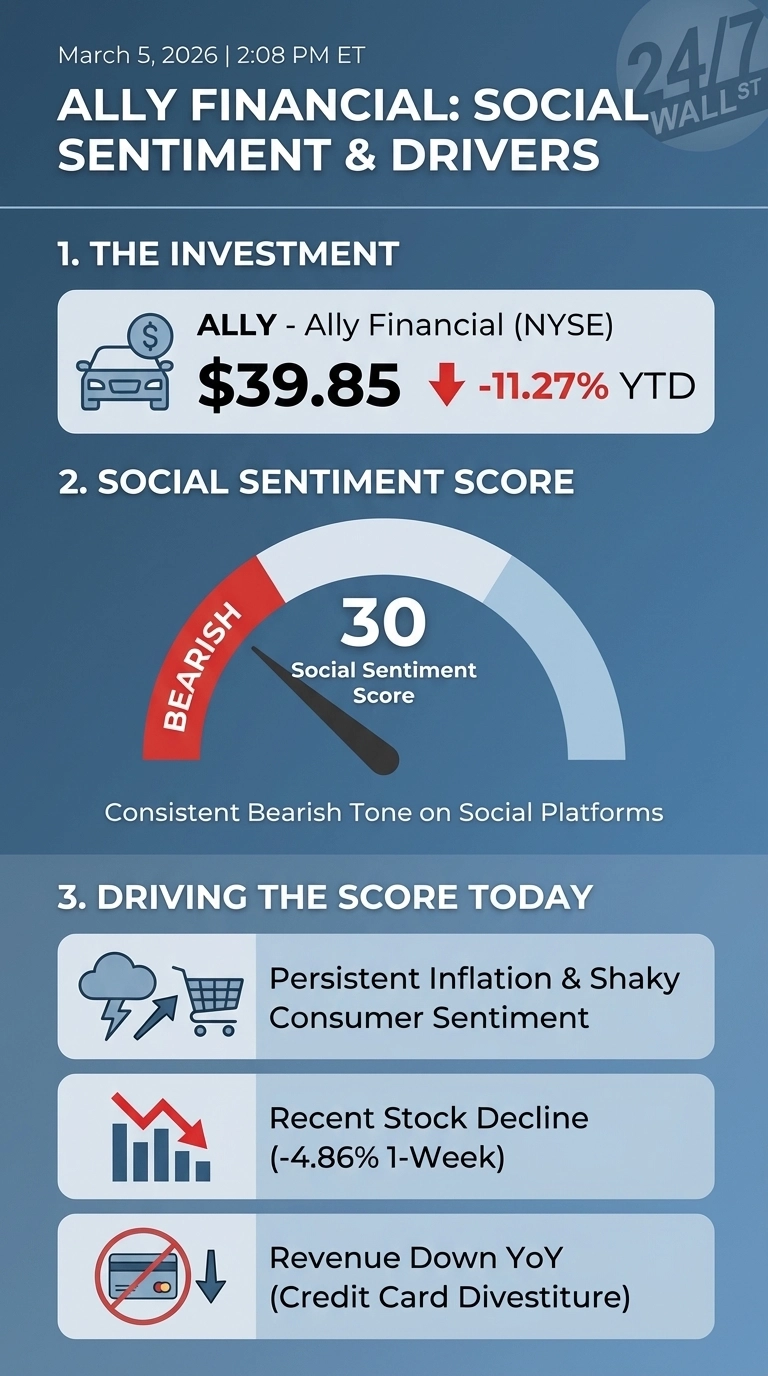
A leading digital bank and financial services company, Ally Financial (NYSE:ALLY) is down 12.34% year-to-date, trading near $39.85 after opening 2026 at $44.97. The pressure comes from multiple directions: persistent inflation, shaky consumer sentiment, and tariff uncertainty hanging over auto demand. Retail investors on Reddit are noticing, and the tone is not optimistic.
The macro backdrop is genuinely uncomfortable for an auto-focused lender. The University of Michigan Consumer Sentiment Index sits at 56.4, deep in pessimistic territory, while Core PCE has risen steadily throughout 2025 to reach the 90th percentile of historical levels. For a company whose business model depends on consumers financing vehicles, that combination matters.
Reddit’s Verdict on Ally Is Bearish and Getting Louder
Social sentiment on Ally has been consistently bearish across r/investing from late February through early March, with scores ranging from 25 to 35 on a 0-to-100 scale. Activity spiked on February 27, the busiest stretch in the dataset. The composite sentiment score sits at 46.55, pulled down by a social score of just 30 even as news sentiment reads a more constructive 63.09. The gap between what journalists are writing and what retail investors are feeling is real.
Three reasons driving the bearish lean:
- Macro headwinds are structural. Higher unemployment expectations and used car price uncertainty create direct credit risk for Ally’s auto book.
- The -4.86% one-week decline has reinforced near-term selling pressure, and investors are skeptical that a buyback authorization will change that calculus quickly.
-
Adjusted total net revenue of $8.5 billion grew 6% year-over-year when excluding the credit card business sale, masking strong operational momentum beneath headline figures that show only 3% growth on a GAAP basis.
Ally’s Own Numbers Tell a More Complicated Story
As Q4 2025 earnings revealed, the company has improved fundamentals. “Adjusted EPS of $3.81 was up 62% year over year. Core ROTCE of 10.4% was up more than 300 basis points versus 2024,” CEO Michael Rhodes told analysts. The buyback authorization, announced in December, was framed carefully: “The resumption of repurchases is not a declaration of victory, but a clear indication of the progress we’ve made and our confidence in the path ahead.” CFO Russ Hutchinson added that the pace would be “low and slow,” with only $24 million repurchased so far.
The Gap Between Analyst Targets and Street Reality
Analysts remain bullish, with a $49.87 average price target and 13 Buy ratings anchoring the consensus. Institutional conviction appears firm, following recent upgrades from TD Cowen and UBS, betting on Ally’s profit trajectory. The narrative relies on credit resilience, auto charge-offs dropped 36 bps year-over-year to 1.88%, and a stable NIM ex-OID of 3.55%. While management’s 3.45%–3.50% NIM guidance offers a floor, cracks are appearing: sequential auto income softness and the first break in deposit growth in 66 quarters invite scrutiny. With tariff uncertainty and depreciation headwinds, Q1 delinquency data will reveal if the current profitability inflection is durable or merely a fleeting recovery.