Gladstone’s 10.4% Yield Survives Rate Freeze With Modest Leverage and Loan Growth

Photo of David Beren
By David Beren Published

Quick Read

  • Gladstone Capital (GLAD) cut its monthly distribution from $0.165 to $0.15 per share and now covers it with net investment income of approximately 1.1 times, down from a cushion that allowed higher payments, as portfolio yield compressed from 13.9% to 12.2% following Federal Reserve rate cuts.

  • The company grew its loan book to $772.3 million and refinanced higher-cost debt into 5.875% convertible notes, stabilizing net interest income per share despite yield compression, but further deterioration in credit quality or loan growth would trigger another distribution cut.

  • The analyst who called NVIDIA in 2010 just named his top 10 AI stocks. Get them here FREE.

This post may contain links from our sponsors and affiliates, and Flywheel Publishing may receive compensation for actions taken through them.
Gladstone’s 10.4% Yield Survives Rate Freeze With Modest Leverage and Loan Growth

© 24/7 Wall St.

Gladstone Capital Corp (NASDAQ:GLAD) carries a yield near 10.4% and a monthly payment structure that appeals to income-focused investors. Whether that income stream holds up depends on mechanics that are easy to misread from the headline number alone.

How GLAD Produces Its Monthly Income

Gladstone Capital is a business development company that functions as a publicly traded private lender. It raises capital, deploys it as loans to smaller private businesses, and is required to distribute at least 90% of taxable income to maintain its tax-advantaged pass-through status. Income comes primarily from interest on debt investments, supplemented by origination fees and prepayment penalties.

The correct income metric for BDC analysis is net investment income (NII) per share, not earnings per share. NII captures cash interest and fees collected, minus operating expenses, to fund the monthly distribution and determine whether the dividend is safe. GLAD recently reduced its monthly payout from $0.165 to $0.15 per share, bringing the yield closer to 10% and reflecting management’s priority of sustainable coverage over unsustainable headline rates.

Approximately 72% of debt investments at cost are secured first lien assets, placing Gladstone Capital structurally higher in the repayment hierarchy than BDCs that rely heavily on subordinated debt. The tradeoff is a more defensive, lower-yielding credit profile, but one that prioritizes capital preservation and distribution stability over maximizing current income.

Coverage Is Thin but Consistent

The distribution was cut once. Gladstone Capital reduced its monthly common distribution from $0.165 to $0.15 per share starting in Q4 2025, driven by yield compression from Federal Reserve rate cuts. Since the reduction, NII coverage has been tight but consistent:
  • Q1 2026: NII of $0.50 per share covered the $0.45 quarterly distribution
  • Q4 2025: NII of $0.50 per share covered the $0.45 quarterly distribution
The coverage ratio runs approximately 1.1 times. Any further compression in portfolio yield would put the distribution at risk again. Some coverage metrics use trailing EPS, which includes non-cash unrealized gains and losses, but NII coverage is the relevant lens for BDCs. On that basis, the distribution is currently covered, though with minimal cushion.
An infographic with the title 'Gladstone Capital Corp (GLAD) ETF: 10% Yield Resilience?'. Section 1, 'WHAT THIS ETF IS', features a globe and gear icon, a diagram showing money flow from investors to BDC to small businesses and returns, and text defining BDC and its distribution requirements. Section 2, 'HOW IT GENERATES YIELD', includes icons of growing stacks of coins and a loan document with interest income, detailing that the portfolio is predominantly floating-rate and showing a Current Weighted Average Yield of 12.2% (Q1 2026), compressed from 13.9% (Q4 2024). Over 70% of debt investments are secured by first liens. Section 3, 'THE STABILITY OF THAT YIELD', shows a shield icon with a checkmark and exclamation, reporting a Current Monthly Distribution of $0.15 per share (reduced from $0.165 in Q4 2025). A bar chart compares NII Q1 2026 at $0.50 with Quarterly Distribution at $0.45. Text describes coverage as thin, notes yield compression risks, and states NAV per share declined to $21.13 (Q1 2026) from $21.34 (Q4 2025). The infographic concludes with a warning about thin margins and future distribution risks. Data is cited as of April 14, 2026.
24/7 Wall St.
This infographic explains Gladstone Capital Corp (GLAD) ETF, detailing how it generates its yield and the factors affecting its stability, including distribution figures and NAV per share.

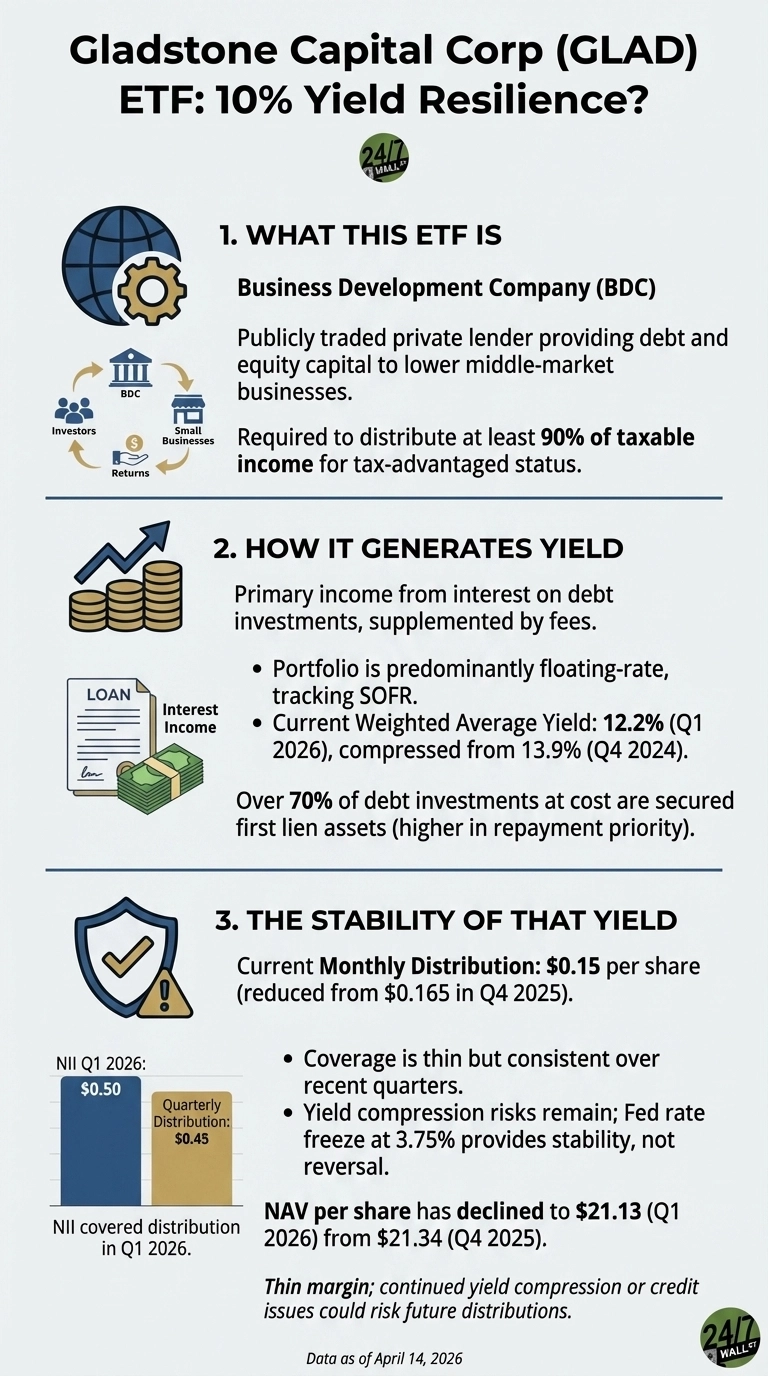
The Rate Freeze: Stability Without Recovery

Gladstone Capital’s portfolio is predominantly floating-rate, so income tracks SOFR. The weighted average yield on the interest-bearing portfolio compressed from 13.9% in Q4 2024 to 12.2% in Q1 2026. The Federal Reserve has held rates at 3.75%, which has stopped further compression but has not reversed it.

Management’s response has been to grow the loan book. The weighted-average principal balance grew from $647.2 million in Q3 2025 to $772.3 million in Q1 2026, the primary lever that kept per-share NII stable as yields declined. It’s also important to note that the portfolio’s ending fair value reached a new high of $902.9 million. President Bob Marcotte noted: “These actions combined with our modest leverage have positioned us well to deliver continued asset growth and sustain our net interest income in support of future shareholder distributions.”

Balance Sheet Refinancing and Credit Trends

Gladstone Capital issued $149.5 million in 5.875% Convertible Notes due 2030 while redeeming higher cost 7.75% and 5.125% notes, lowering interest expense and extending maturity. The credit facility was expanded to $320 million, with the revolving period extended to October 2027 and the final maturity to October 2029.

Portfolio quality shows modest stress. NAV per common share has drifted from $21.30 to $21.10 over recent quarters. That figure is not alarming in isolation, but the direction is consistently downward.

Total Return and Price Context

Shares are around $18, down roughly 20 percent over the past year, depending on the starting point. The 52-week range spans roughly $16.50 to $29.50. At the current price, the annualized $1.80 distribution generates a yield near 10 percent. That yield is elevated partly because the stock has declined, not because the income has grown.

The analyst consensus target is around $22, with three buy ratings and three hold ratings from covering analysts.

Distribution Safety Verdict

The $0.15 monthly distribution is covered at current NII levels, but the margin is narrow. Portfolio yield, NAV, and fair value as a percentage of cost are all trending lower. The rate freeze provides stability, not reversal. A second cut is possible if loan book growth stalls or credit quality deteriorates. Total return depends heavily on reinvested dividends, given the price decline over the past year.

Data Sources

  • Gladstone Capital’s 10% yield comes with a hidden strength: dividend coverage that actually holds (247 Wall St., April 13, 2026): Used for NII coverage ratios, portfolio composition, balance sheet refinancing details, and distribution cut context.
  • Federal Reserve Economic Data (FRED) via Fuse API: Fed funds rate history and current 3.75% rate freeze since December 10, 2025.
  • Alpha Vantage OVERVIEW and DIVIDENDS endpoints: Current yield, payout ratio, 52-week range, analyst ratings, and dividend payment history.
  • Fuse API earnings data: Quarterly NII per share, total investment income, portfolio yield, weighted average principal balance, and NAV trends across Q2 2025 through Q1 2026.
Photo of David Beren
About the Author David Beren →

David Beren has been a Flywheel Publishing contributor since 2022. Writing for 24/7 Wall St. since 2023, David loves to write about topics of all shapes and sizes. As a technology expert, David focuses heavily on consumer electronics brands, automobiles, and general technology. He has previously written for LifeWire, formerly About.com. As a part-time freelance writer, David’s “day job” has been working on and leading social media for multiple Fortune 100 brands. David loves the flexibility of this field and its ability to reach customers exactly where they like to spend their time. Additionally, David previously published his own blog, TmoNews.com, which reached 3 million readers in its first year. In addition to freelance and social media work, David loves to spend time with his family and children and relive the glory days of video game consoles by playing any retro game console he can get his hands on.

Continue Reading

Top Gaining Stocks

MU Vol: 46,742,431
DAL Vol: 13,590,122
AXON Vol: 1,268,628
COIN Vol: 9,122,393
TDG Vol: 382,597

Top Losing Stocks

KMX Vol: 12,364,943
AKAM Vol: 7,270,970
APA
APA Vol: 6,622,705
WFC Vol: 26,818,651
OXY Vol: 13,012,752