Kimbell Royalty Partners recently hit an all-time high of $15.82, driven by a 43.74% earnings beat in Q4 2025 and a 6% distribution increase from Q3 to Q4. For income investors, the question is whether a 10.2% annualized yield backed by Permian Basin royalties can withstand swings in oil and gas prices.
Royalties, Not Rigs: How KRP Generates Its Income
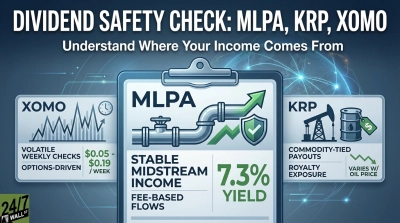
Kimbell Royalty Partners (NYSE:KRP) is a mineral and royalty interest owner rather than an operator. It holds interests across roughly 17 million gross acres of U.S. onshore acreage, and when operators drill and produce oil, natural gas, or NGLs on that land, KRP receives a proportional royalty payment. It does not fund drilling, incur lease operating expenses, or carry capital expenditures.
Distributions therefore depend on two variables: production volumes on KRP’s acreage and the prices of the underlying commodities. The company’s 2026 guidance calls for 24,000 to 27,000 Boe per day with a mix of 30 to 34 percent oil, 46 to 50 percent natural gas, and 18 to 22 percent NGLs. KRP distributes 75 percent of cash available for distribution to unitholders and uses the remaining 25 percent to reduce debt.

What the Distribution History Actually Shows
KRP’s quarterly distributions are intentionally variable, reflecting the swings in commodity‑driven cash flow. During the 2020 oil price collapse, the payout dropped from $0.38 in Q1 to $0.13 in Q3, a reduction of roughly two‑thirds over two quarters. As prices recovered, so did the distribution, reaching $0.55 per unit by Q3 2022 during the energy upcycle.
Recent results show a narrower band. The four 2025 distributions totaled $1.60 per unit, ranging from $0.47 in Q1 to $0.35 in Q3. The Q1 peak reflected record cash available for distribution following the Mabee Ranch acquisition, while the Q3 trough corresponded to softer realized commodity prices.
Commodity Prices: The Central Risk in 2026
KRP’s payouts fluctuate by design because the partnership passes through whatever cash flow the commodity markets provide. You can see how that plays out in real time: during the 2020 oil collapse, the quarterly distribution slid from $0.38 in the first quarter to $0.13 by the third, a drop of about two‑thirds as prices cratered. When the cycle turned, the payout returned, reaching $0.55 per unit in the third quarter of 2022 as energy prices surged.
The pattern has been tighter more recently. Throughout 2025, KRP paid $1.60 per unit, with quarterly distributions ranging from $0.47 in the first quarter to $0.35 in the third quarter. The strong first‑quarter number reflected record cash available for distribution after the Mabee Ranch acquisition, while the softer third‑quarter payout simply mirrored weaker realized commodity prices.
Balance Sheet and Coverage
The Mabee Ranch acquisition in January 2025 added $230 million of new debt, which pushed total liabilities higher but also expanded KRP’s production base. By the end of Q4 2025, the partnership had $441.5 million drawn on its revolving credit facility, leaving $183.5 million in unused capacity against a $625 million borrowing base. Even with the acquisition financing, leverage remained modest: net debt‑to‑trailing adjusted EBITDA sat near 1.5x, which is comfortably conservative for a royalty business. KRP also improved its balance sheet flexibility in December 2025 by extending and repricing the credit facility, trimming borrowing costs by 35 basis points, and pushing the maturity out to December 2030.
Cash generation has been steady throughout the year. Operating cash flow came in at $57.2 million in the fourth quarter and reached $72.3 million in the second quarter. Because KRP allocates 25 percent of its available cash to debt reduction, it has steadily deleveraged while still paying meaningful distributions. Over the course of 2025, the partnership paid down roughly $57.4 million on its credit facility.
Production Stability and Rig Count
KRP’s royalty-only model insulates it from capital spending cycles, but it cannot force operators to drill. Active rigs on KRP acreage declined from 90 in Q1 2025 to 85 in Q4 2025, a gradual trend that mirrors a broader U.S. land-rig slowdown. The line-of-sight well inventory provides a buffer: Q4 2025 showed 7.09 net line-of-sight wells versus the 6.8 needed to maintain flat production. That buffer has held above maintenance levels throughout 2025, supporting the flat 2026 guidance.
Proved developed reserves grew 8% in 2025 to a record of nearly 73 million Boe. The Barnett-Woodford development opportunity on existing acreage, where KRP pays nothing for delineation or test wells as the mineral owner, represents additional upside that does not require new capital deployment.
Total Return and Tax Treatment
Units have gained 26.4% year to date and 34.5% over the past year, so the distribution yield has been augmented by price appreciation. The full-year 2025 distributions were classified 100% as a return of capital, meaning that unitholders did not owe ordinary income tax on those payments. Return of capital distributions reduces the unitholder’s cost basis rather than generating immediate taxable income.
Distribution Sustainability Depends on Oil Prices Holding
KRP’s distribution is not guaranteed at any fixed level. The 2020 drawdown to $0.13 per quarter is the relevant stress test. With oil near multi-year highs, hedges running through early 2027, a 1.5x leverage ratio, and well inventory above maintenance levels, near-term distribution coverage has remained above maintenance thresholds. The primary risk is a sustained decline in oil prices back toward the December 2025 lows, which would compress the cash available for distribution. KRP’s structure requires comfort with variable distributions tied to energy prices and the MLP tax reporting framework that comes with a K-1.
Contact [email protected] for any questions or corrections.