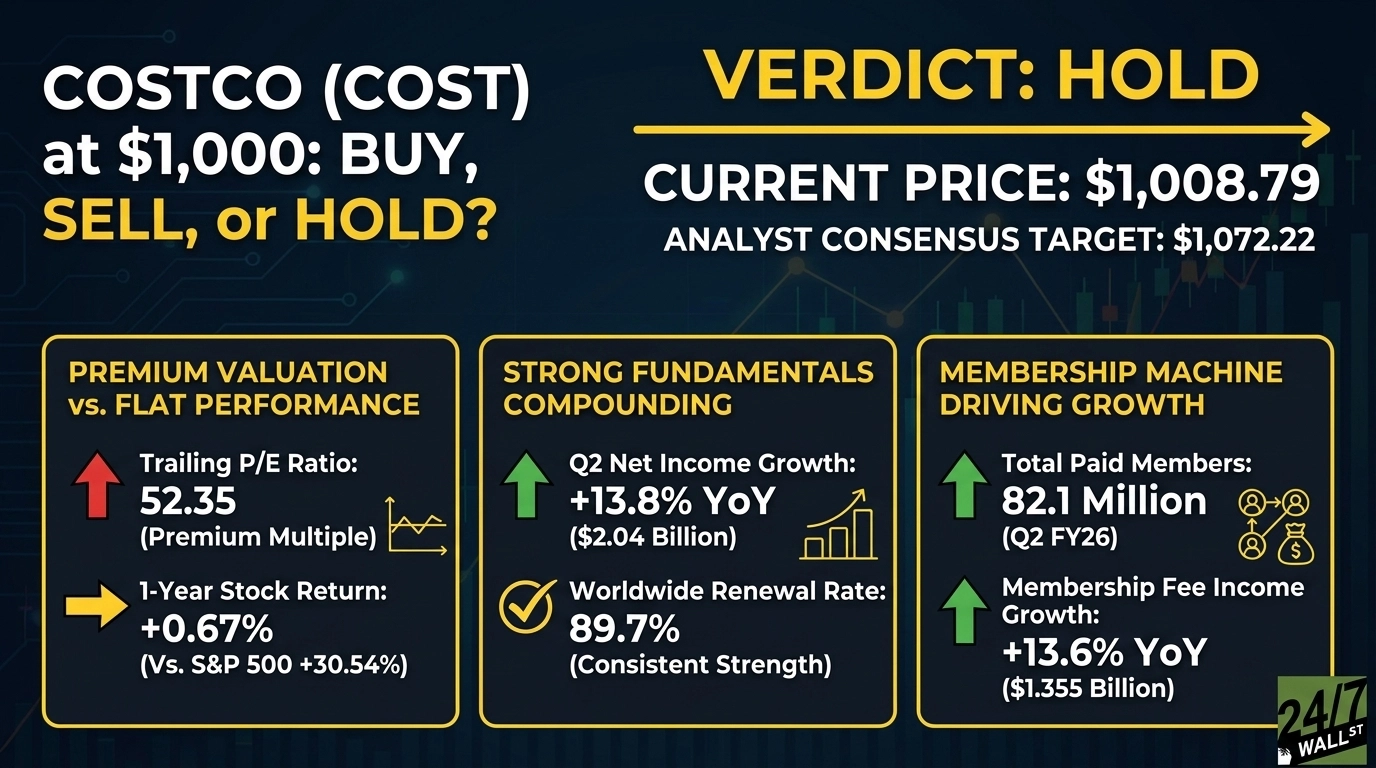
At $1,008.79, Costco (NASDAQ:COST | COST Price Prediction) is a hold. The warehouse club executes at an elite level, yet its stock has gone almost nowhere for a year, leaving investors to weigh near-flawless fundamentals against a valuation that already assumes they continue.
Costco runs 924 warehouses worldwide and serves 82.1 million paid members, anchoring a fee-driven flywheel that generated $1.35 billion in membership income last quarter. The shares first touched four digits in May 2025 at $1,000.76, then dipped to $877.05 by December before grinding back. The result is a stock that has compounded earnings while testing investor patience.

Why this stock demands a fresh look at $1,000
Costco has delivered double-digit net income growth for four straight quarters, yet the price chart looks flat. That gap between operating performance and stock performance is the entire debate.
A membership machine still compounding at double digits
The Q2 FY26 report was strong. Net income rose 13.8% to $2.04 billion, comparable sales climbed 7.4%, and digitally-enabled comps surged 22.6%. Membership fee income jumped 13.6%, while the worldwide renewal rate held at 89.7%.
Executive membership penetration hit 75.8% of sales, with 40.4 million executive members now driving the most profitable tier. Costco is targeting 942 warehouses by fiscal year-end and 30-plus new openings per year thereafter. Year to date, COST has returned 17.31%, outpacing the S&P 500’s 8.17%.
A 52 P/E paired with a year of flat returns
Costco trades at a trailing P/E of 52 and a forward multiple of 46, with a PEG of 5.12 and a dividend yield of 0.51%. That is growth-stock pricing on a consumer staple.
Over the past year, COST has returned 0.67% versus 30.54% for the S&P 500. Management flagged “new global tariffs for at least the next 150 days”, rising labor and healthcare costs, FX volatility, and a Q2 core margin that was lower by 3 basis points year over year. With the multiple this rich, any deceleration in comps could compress it quickly.

Fundamentals compound while the stock waits
The business is widening its moat. Holders have earned nothing for twelve months while the broader market ran. Both sides have a point, which is precisely the hold setup.
A clear buy trigger would be a pullback toward 200-day moving average near $952.11, a special dividend, or comps reaccelerating above 8%. A sell trigger would be comps sliding under 5%, renewal rates breaking below 89%, or tariff costs forcing visible margin compression.

What the numbers actually say at this price
COST trades at $1,008.79 against a consensus analyst price target of $1,072.22, implying upside of roughly 6%. The rating spread across 36 analysts skews constructive: 3 Strong Buy, 19 Buy, 12 Hold, 2 Sell, and 0 Strong Sell. COST is down 1.94% over the past month while the S&P 500 ran 9.11%. Shares sit between a 52-week range of $841.69 and $1,061.11, with a beta of 0.908.
The case for sitting tight on Costco
At $1,008.79, Costco is a hold.
The cost of patience is low. With analyst upside of roughly 6% and a dividend yield of 0.51%, the 12-month forward return is roughly market-like. The cost of acting prematurely is real: chasing a 52 P/E into a tariff-pressured year, or selling a business compounding net income at 13.8% with 89.7% renewals.
Watch three metrics quarter by quarter: comp sales versus the recent 7.4% mark, membership fee growth versus the 13.6% trend, and gross margin against the 11.02% base, with tariff impacts as the swing factor. Any one breaking trend recasts the verdict.
Reddit sentiment at a composite 63.62 reflects the same mood: constructive but measured. When a great business trades at a great-business multiple after a year of flat returns, the setup favors patience over action, with the next catalyst likely to pick the direction.
Contact [email protected] for any questions or corrections.