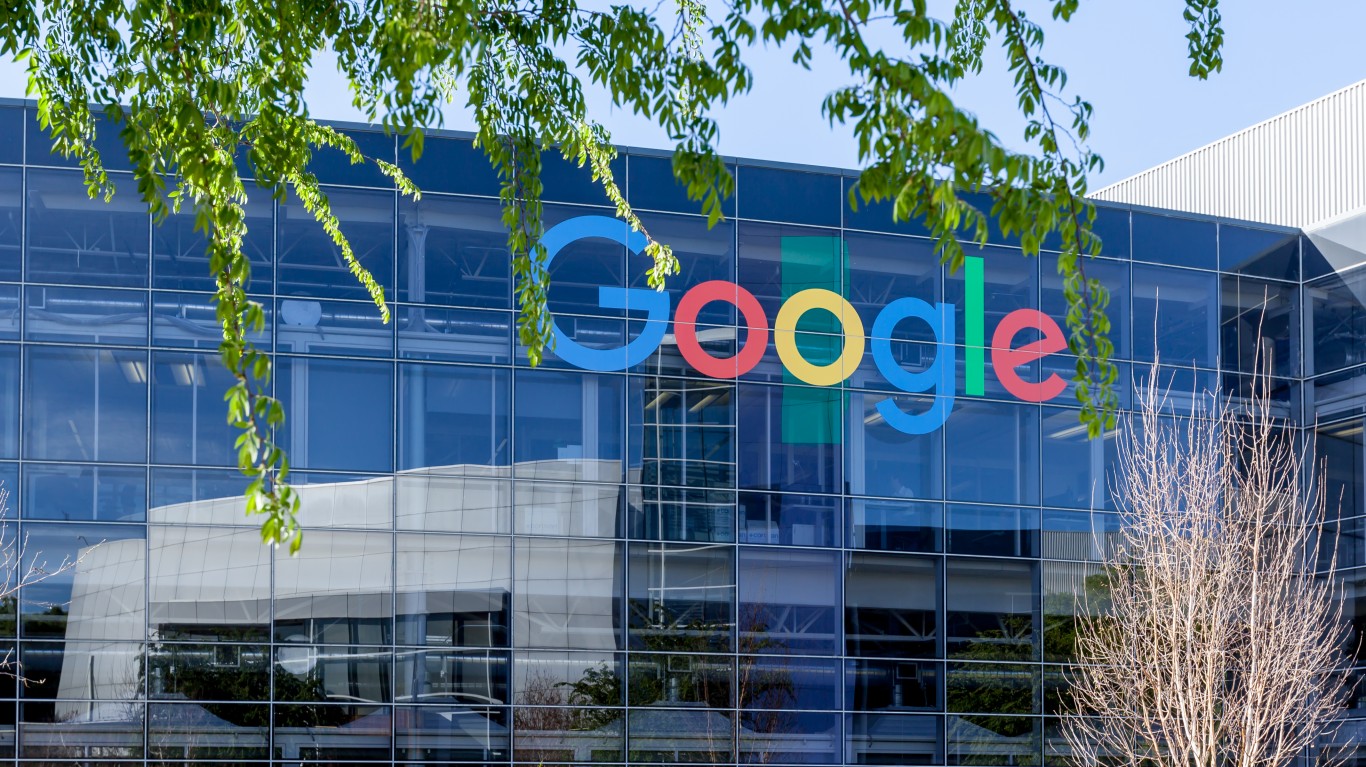
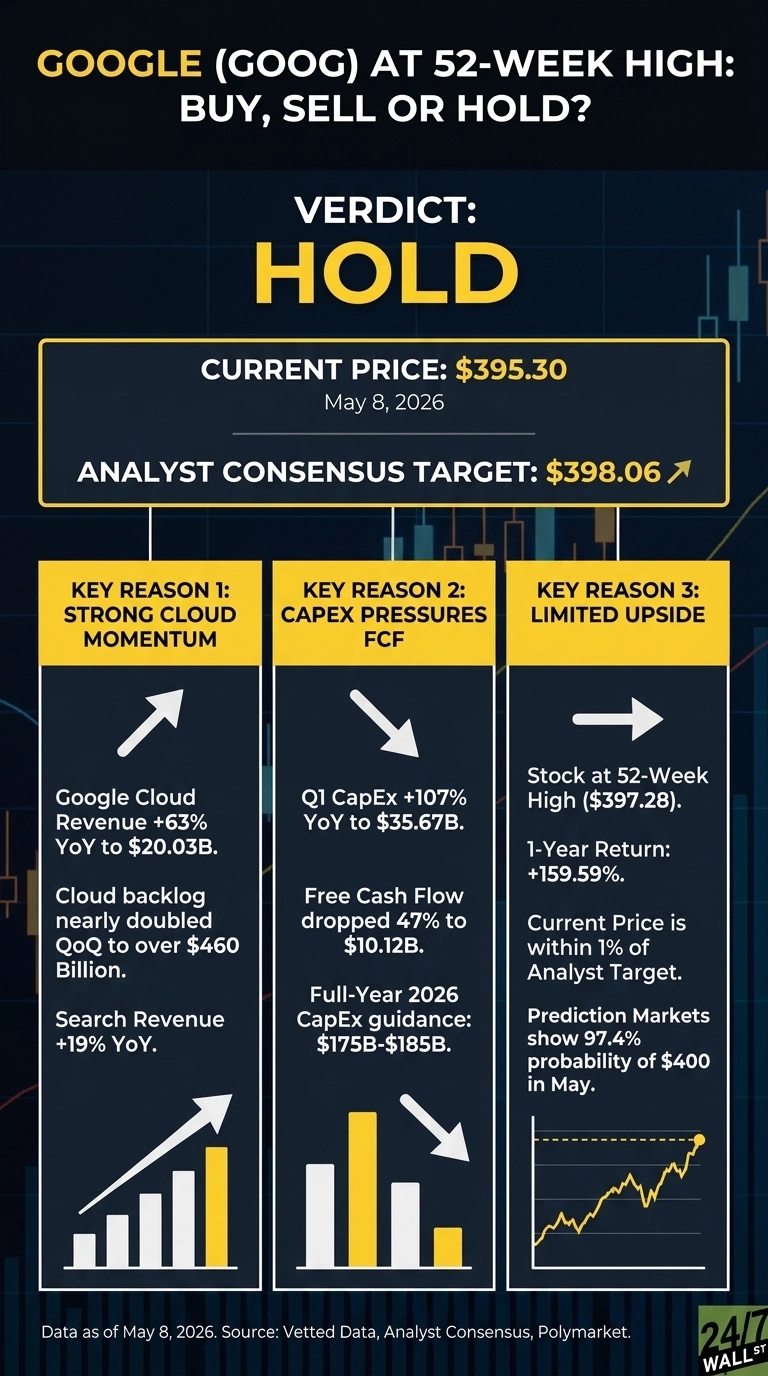
At $395.30, Google (NASDAQ:GOOG | GOOG Price Prediction) is a hold. The stock is pressed against its $397.28 52-week high after a strong rally, and consensus price targets have caught down to spot rather than the other way around.
Alphabet’s Class C shares have rallied 159.59% over the past year on an AI narrative with hard numbers: Cloud growing at hyperscale speed, Search reaccelerating, and a Q1 earnings report that beat expectations. The flip side is CapEx that has more than doubled and a valuation no longer cheap on any near-term basis.
Why the Stock Got Here
Google still earns the majority of revenue from Search and YouTube, but the bull thesis has shifted to Google Cloud and Gemini. Q1 FY2026 revenue of $109.90B grew 21.79% YoY, and EPS of $5.11 beat the $2.63 estimate. The stock has gone vertical since.
The Bull Case: Cloud Is a Second Engine
Google Cloud revenue surged 63% YoY to $20.03B, and the backlog nearly doubled quarter over quarter to over $460 billion. That is multi-year visibility most software companies can only dream of. Search accelerated to 19% growth, undercutting the thesis that AI assistants would gut the franchise. Gemini is now processing more than 16 billion tokens per minute via API, up 60% sequentially.
Operating income jumped 29.7% to $39.70B, with operating margin expanding to 36.1%. Wall Street has noticed: 13 Strong Buy and 47 Buy ratings sit against just 6 Holds and zero Sells.
The Bear Case: CapEx Is Eating Free Cash Flow
Q1 capital expenditures hit $35.67B, up 107.44% YoY, and management guided full-year 2026 CapEx to $175B-$185B. Free cash flow collapsed 46.63% to $10.12B. Q1 net income was also flattered by $36.91 billion in unrealized equity gains, which is not recurring earnings power.
Google Network ad revenue slid from $7.26B to $6.97B, regulatory overhang remains, and insider activity has been net selling across 156 transactions. At a 30 trailing P/E with FCF compressing, bears argue the easy money has been made.

The Hold Case: Target Already Met
Polymarket’s monthly contract assigns a 97.4% probability that GOOGL touches $400 in May but only 64.3% for $410. That signals the next leg is incremental, not explosive. Buyers here are paying full price for execution already delivered.
The reasonable path forward is to wait for either a Cloud margin report that justifies the CapEx, or a pullback that resets the entry.
What the Data Says
GOOG currently trades at $395.30 against an analyst consensus target of $398.06, implying roughly 0.7% upside. When 60-plus analysts collectively land within a percent of spot, the message is clear: the price already reflects the story.
The trailing P/E sits at 30, with a forward multiple near 28. Year to date GOOG has returned 26.06% versus 7.28% for the S&P 500, and over the past year 159.59% versus 30.37%. That is roughly five times the index.
The Verdict: Wait for a Better Pitch
At $395.30, Google is a hold. The fundamentals are strong: Cloud at 63% growth with a $460B backlog, Search reaccelerating, Waymo at 500,000 rides per week, and a fortress balance sheet do not describe a stock investors should dump. But buying a 52-week high after a 159.59% one-year run, when consensus targets imply less than 1% upside, is a different question.
The trigger for a buy upgrade is a meaningful pullback toward the $318 50-day moving average, or a Q2 earnings report showing Cloud margins expanding alongside CapEx. I do see the stock soaring higher next year but it is advisable to wait for a dip.
The trigger for a Sell is Cloud growth deceleration combined with no FCF recovery by year-end. Until then, the risk/reward favors patience over fresh commitments at the high.

Contact [email protected] for any questions or corrections.