Although Wall Street has spent the spring of 2026 in melt-up mode, with the S&P 500 up 26% over the past year and tacking on another 8.6% in just the last month, this morning’s inflation report rattled the easy narrative. The Bureau of Labor Statistics’ headline CPI index pushed to 332.4 as of April, a 0.6% monthly jump that lifts the gauge to its highest level in roughly three years. Inflation, the story we were told was buried, just clawed its way back into the headlines.
What’s particularly notable is the breadth of the move. The current reading sits in the 90.9th percentile of the past 12 months, and the Fed’s preferred gauge is moving the same direction. Core PCE hit 129.28 in March, also a fresh 12-month high in the 90.9th percentile of its own range. I’ve been watching the monthly CPI series for the better part of two decades, and the last time it landed this hot, the playbook that followed surprised almost everyone.
The Long Memory: 2021-2022
The cleanest analog is the post-COVID inflation surge that ran from 2021 into 2022. Inflation built steadily that year, the Fed dismissed it as transitory, and then the math caught up with the rhetoric. Stocks did something most investors have already memory-holed.
Across 2021 and 2022 together, the S&P 500 ETF went from $368.79 on January 4, 2021 to $382.43 on December 30, 2022. That is a total return of 3.7% over two full years. A grinding, frustrating round trip that punished anyone who chased the 2021 highs and shook out anyone who panicked at the 2022 lows.
Extend the window to the period most economists tag as the actual inflation-shock cycle, October 2021 through September 2023, and the picture sharpens. SPY went from $434.24 to $427.48, a return of negative 1.56% over nearly two years. The index essentially treaded water through the worst inflation episode in a generation, even as nominal earnings grew and the headline economy chugged along.
What’s Similar, What’s Different
Here is where the historian has to be honest. The 2021-2022 analog rhymes, but it does not repeat note for note.
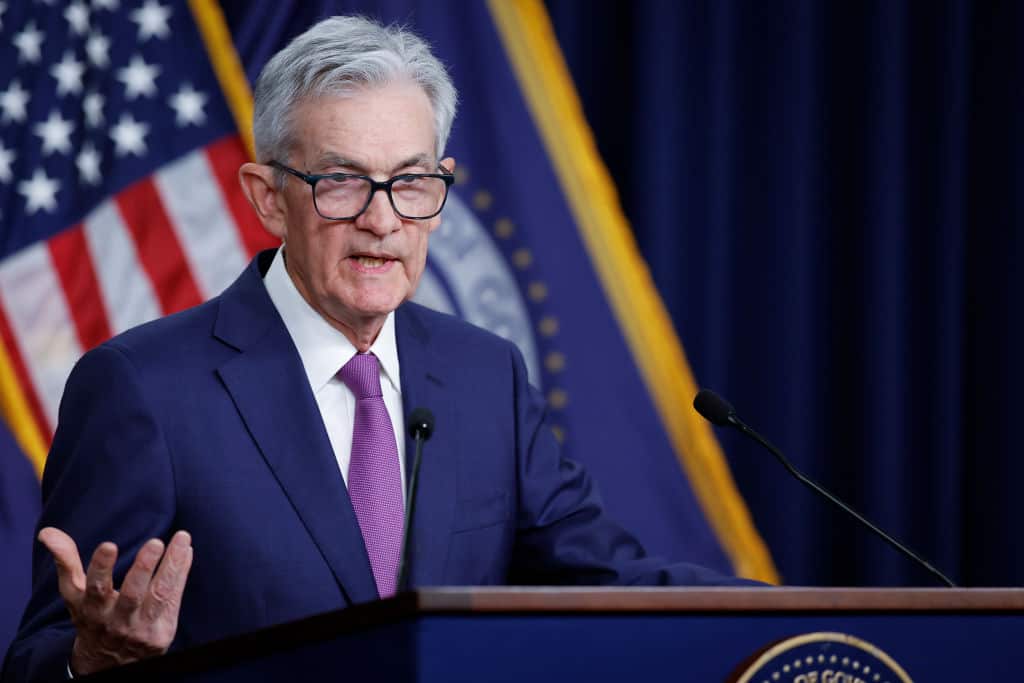
Start with the Fed. In 2021, policy rates were pinned near zero, and the central bank spent the better part of a year insisting the inflation pulse was transient before pivoting into one of the most aggressive hiking cycles in modern history. Today, the Fed funds upper bound sits at 3.75%, down 75 basis points from the September 2025 peak of 4.5%, and has held steady for roughly five months.
The Fed enters this inflation flare-up with the policy lever already restrictive, not loose. The Fed doesn’t have a cream for this one. But that might be alright. Stay with me here.
The labor market also looks different. Unemployment is 4.3%, sitting in the middle of its 4.1% to 4.5% 12-month range, healthy but not the sub-4% scorcher that drove wage-price spiral fears four years ago. The 10-year Treasury yield, at 4.38%, sits well below its 4.58% peak from May 2025. The bond market, in other words, has not yet recoiled the way it did in 2022.
Investor fear tells the same in-between story. The VIX spiked to 31.05 on March 27, 2026, a genuine fear flare that lined up with the early innings of this inflation re-acceleration. It has since drifted back to 18.38, well inside the normal 15-20 band. Complacency is creeping back in, but it has not fully arrived.
The Honest Base Rate
The goal of this column is no prediction without a pattern. With one verified precedent in the dataset, the honest answer is that we have N=1. You cannot build a high-confidence base rate out of a single observation, and any writer who tells you otherwise is selling certainty that the data does not support.
What the 2021-2022 analog does establish, modestly, is the shape of the typical outcome. During the only directly comparable CPI spike in recent memory, the S&P 500 went sideways for roughly two years while the inflation problem was digested, then resumed its march higher. Most investors I talk to remember the 2022 drawdown and the 2023 recovery as separate stories. They were the same story.
Long term, the benchmark S&P 500 still grinds higher. Over the past decade, SPY is up 260%, even with the 2022 round trip baked in. Today’s CPI does not change that arithmetic. It just reminds you that the path between here and there is rarely the straight line the last twelve months have drawn.
Contact [email protected] for any questions or corrections.