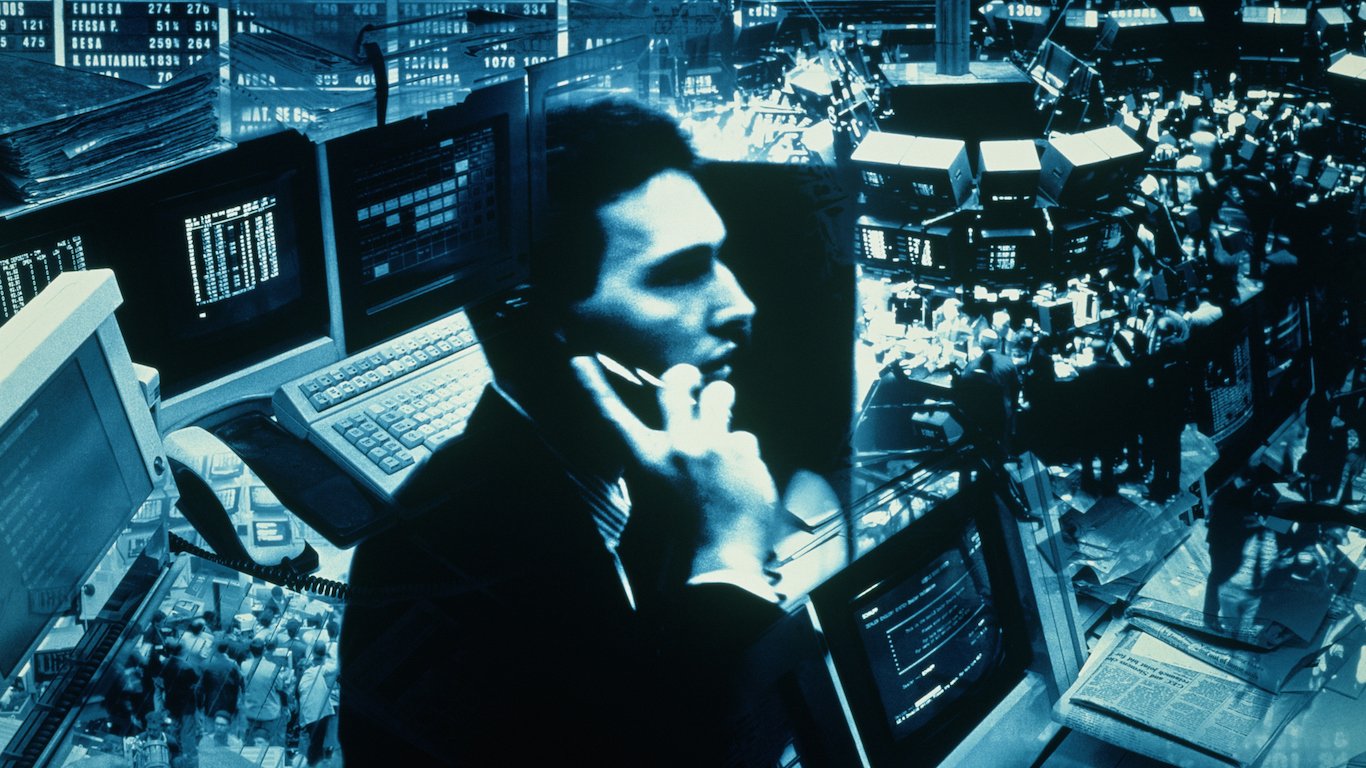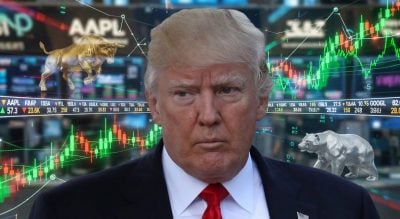
A CNBC commentator delivered the line of the week on the network’s market coverage: "Trump has been responsible for the five best and five worst trading days of his second term." Strip those five up days out of the index since inauguration and the broad market is essentially flat. Leave them in and you get a respectable bull run. That is the entire story of this market in one sentence.
The numbers back the framing. The SPDR S&P 500 ETF (NYSEARCA:SPY) is up 21.67% from the day after inauguration through May 19, 2026, closing at $733.73. The commentator’s claim that the index would be only slightly positive without those five sessions tracks with what actually happened in between: from January 21, 2025 through April 8, 2025, SPY fell 17.67%, from $603.05 to $496.48, before a single afternoon reversed most of the damage.
The April 9 Pivot
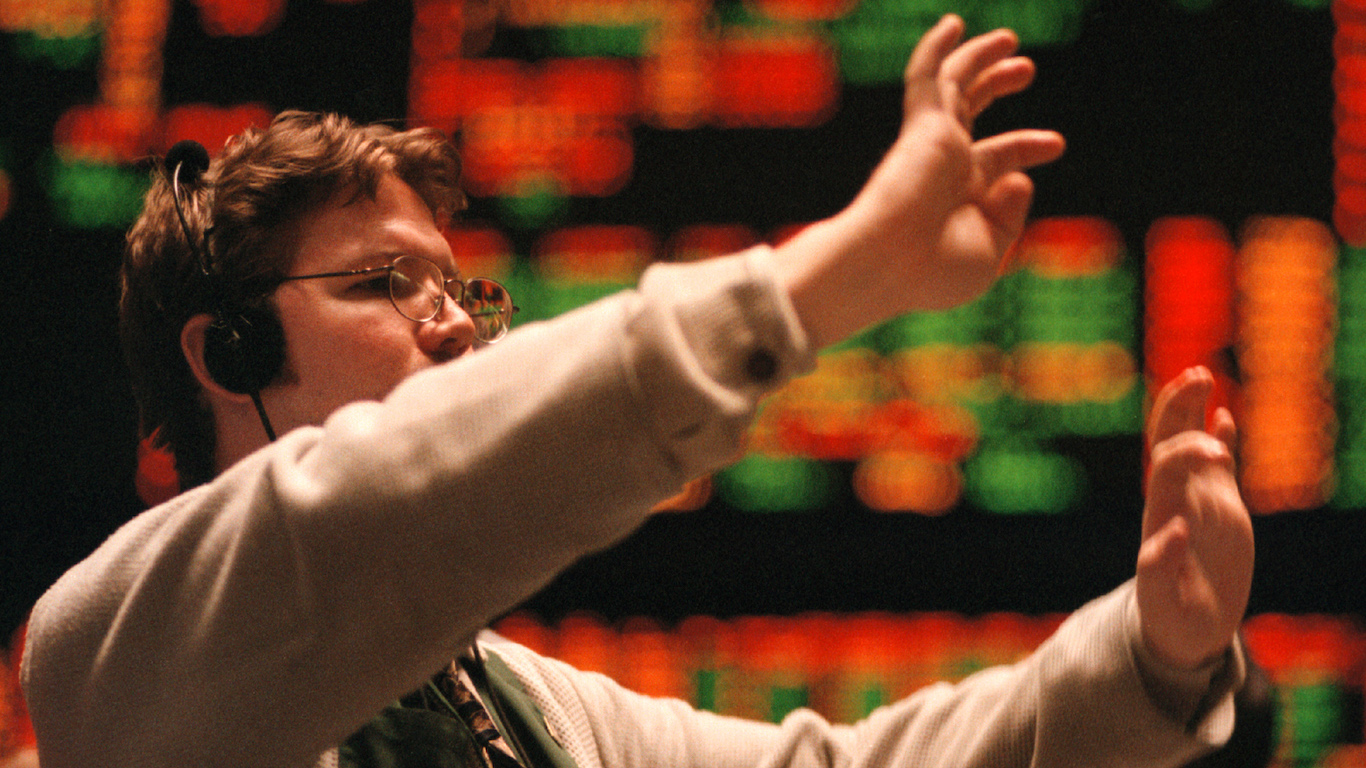
The single best day of the term was April 9, 2025, when the S&P 500 surged more than 9% after Trump announced a pause on sweeping tariffs. SPY closed that week with a 5.86% gain from April 7 through April 11. That one trading session pulled the index out of a tariff-driven freefall and reset the entire narrative for the rest of the year.
The setup matters. Institutional desks had been derisking into the tariff announcement, and the pause caught a heavily underweighted market flat-footed. The CNBC guest acknowledged that FOMO is a real factor for institutional investors. When the largest pools of capital are forced to chase a 9% gap, the bid stays in for days.
A Market Wired to Headlines
The volatility data confirms a market reacting to policy rather than earnings. The VIX peaked at 31.05 on March 27, 2026, the highest reading in the trailing 12 months, then bled lower into the 18.06 reading on May 19. That spike clustered with another in early April 2026, the same pattern that defined April 2025: tariff headline, fear gauge rips, policy walk-back, mean reversion.
The macro backdrop is less forgiving than the index level suggests. The University of Michigan consumer sentiment reading sits at 53.3 as of March 1, 2026, down from 56.6 the prior month and well inside recessionary territory. The 10-year Treasury yield closed at 4.61% on May 18, 2026, the high of the trailing year and a 99.6 percentile reading. The trade deficit, the data point that drives most of the tariff rhetoric, stood at $60.3 billion in March 2026, in the middle of a range that swung from $31.1 billion to $74.2 billion over the year.
Those readings describe an economy where consumers are anxious, financing costs are at cycle highs, and trade policy can move the index 9% in a session. Fundamentals are along for the ride.
The Practical Takeaway
The CNBC segment landed on a blunt rule: "don’t fight the White House because you’re going to lose and you’re not going to make any money." That is uncomfortable advice for fundamental investors, and it is consistent with the data. Anyone who tried to short the April 9, 2025 rip got run over. Anyone who panic-sold the March 2026 VIX spike missed the reversion to 18.06.
The lesson for individual investors is narrower than it sounds. Position sizing matters more than directional conviction when a single press conference can produce both a top-five and bottom-five trading session. Hedges that looked expensive in December 2025, when the VIX hit 13.47, paid for themselves three months later. The next policy headline will hit a market trading at full multiples with yields at 12-month highs, and the asymmetry of being out of position has not changed.
Contact [email protected] for any questions or corrections.