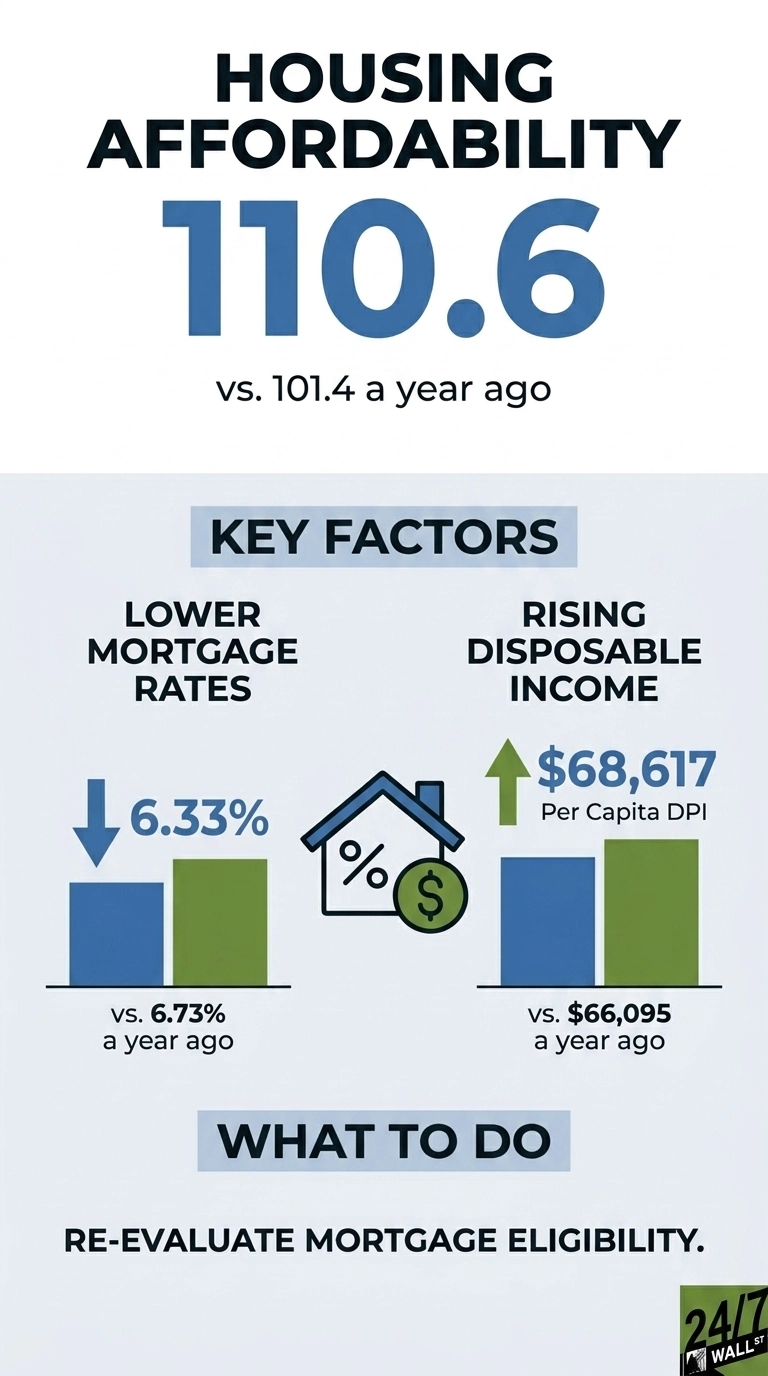
The National Association of Realtors’ Housing Affordability Index surged to 110.6 during April 2026, advancing from 101.4 twelve months prior, according to the organization’s latest monthly data release. The proprietary index tracks whether a household generating the median domestic income commands sufficient revenue to qualify for a standard mortgage on a median-priced property. Any calculation settling above 100 confirms they do. This aggressive nine-point cyclical expansion represents a structural shift that occurs exclusively when multiple underlying economic variables improve simultaneously, which is precisely what materialized throughout the past year.
Technical Tailwinds and Financing Spread Compression
The headline driver is the mortgage rate. The 30-year fixed averaged 6.33%, down from 6.73% a year ago. A spread of 40 basis points does not sound dramatic in isolation, but on a typical loan size, it changes the monthly principal and interest payment enough to pull some buyers back into qualifying territory. For households that were sitting out the market because the math no longer worked, that is the threshold the index is picking up.
What is unusual about the rate decline is where it came from. The 10-year Treasury, which serves as the benchmark for mortgage pricing, was 4.57% on May 20, 2026, almost identical to the 4.54% reading from a year earlier. The Treasury benchmark stayed flat while the mortgage-to-Treasury spread compressed. Lenders narrowed the premium they charge over the underlying bond, reflecting improved competition and lower risk pricing rather than a broader rally in fixed income.
The Federal Reserve also nudged the picture. The federal funds target upper bound is 3.75%, down 0.75 percentage points from 4.5% a year ago, and has held at that level since December 11, 2025. Cuts to the policy rate take months to filter through to mortgage products, and the timing lines up with the spread compression now visible in lender pricing.
Income has done some of the work, too. Per capita disposable personal income reached $68,617 in the first quarter of 2026, up from $66,095 in the same quarter of 2025. Average hourly earnings in the private sector rose to $37.41 in April 2026, from $36.12 a year earlier. The denominator of the affordability calculation, qualifying income, has been rising while the numerator, the cost of carrying a mortgage, has been falling.
Production Response and Consumer Constraints
Builders are responding to the better math, as housing starts ran at a seasonally adjusted annual rate of 1.465 million in April 2026, inside the 1.2 to 1.5 million range that economists treat as a healthy market. The figure is below March’s 1.507 million, but the 12-month average of 1.365 million indicates sustained activity rather than a fragile bounce.
The caveats are worth taking seriously. Consumer sentiment as measured by the University of Michigan index fell to 49.8 in April 2026, down from 52.2 in May 2025 and 61.7 at the July 2025 peak. Readings below 60 are historically associated with recessionary conditions. Affordability has improved on paper, while the people doing the buying feel worse about the broader economy.
Inflation is not cooperating either. Headline PCE rose 3.5% year-over-year in March 2026, the highest reading in the trailing 12 months, with core PCE at 3.2%. Energy prices jumped 11.56% in a single month. The personal savings rate sits at 4.0%, down from 5.2% in the first quarter of 2025, meaning households are funding consumption out of a thinner buffer than a year ago.
The Reality of a Partial Structural Recovery
The honest read on the April 2026 data is that affordability is responding to rate relief, but the recovery is partial. A household earning the median income can now qualify for slightly more home than it could last spring. That improvement is happening against a backdrop of weakening sentiment, sticky services inflation running at 3.38% year-over-year, and a savings cushion that has thinned. Buyers locked out by 7%-plus mortgages a year ago have a wider opening. Buyers locked out by home prices themselves face the same prices.
For anyone tracking the housing market for a turn, the mechanism behind the index reading matters more than the reading itself. Rates fell because lender spreads compressed while the Fed held policy steady at 3.75%, and incomes kept climbing. If any of those three inputs reverse, the affordability gains the index recorded between 101.4 and 110.6 can give back as quickly as they were earned.
Contact [email protected] for any questions or corrections.