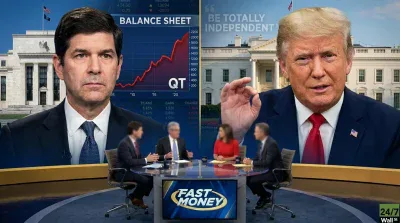
The gap between Wall Street and Main Street just hit a new extreme. On CNBC Friday, Rick Santelli walked viewers through the University of Michigan’s final May sentiment reads, and the numbers landed harder than the mid-month previews suggested. “These are University of Michigan sentiment may final reads. They’re adjusting the mid-month reads, and all of them are lower than expected and lower than our last look,” Santelli reported.
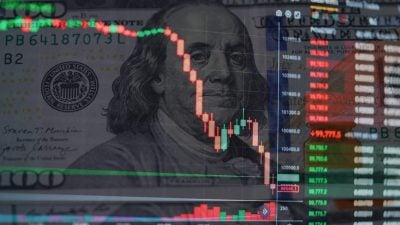
The anchor: “Headline number moves from 48.2 to 44.8. That is another new all-time low going back to the 70s.” Meanwhile, the S&P 500 closed Friday at $7,473.47, sitting on a 9% year-to-date gain and a 28% one-year advance. The Nasdaq-100 is up 17% YTD and 40% over the past year. Records and recession-era pessimism, on the same screen.
What 44.8 Actually Means
The headline figure is only part of the story, and according to the data Santelli cited, the current conditions index hit a new all-time low of 45.8, and the expectations index fell to 44.1, also a record low. The FRED series, baselined to 1966=100, puts the April reading at 49.8, already below the 60 recessionary threshold. May’s 44.8 takes it deeper. For context, the previous all-time low sat near 50.2, set in 2022. May 2026 breaks through it.
Then you have to read the inflation piece: “On the inflation. Also not good news because it’s going up the one-year inflation from 4.7 to 4.8,” Santelli noted. Five-to-ten-year inflation expectations climbed from 3.5 to 3.9. That one-year read is the highest since the early 1980s. Headline CPI corroborates the pressure: the index sits at 332.4 as of April, in the 90th percentile of its 12-month range.
The Geopolitical Read
Santelli connected the sentiment collapse to something external. “Many believe, including myself, that there is definitely something going on here about what’s going on in the [Middle East]. It’s not helping confidence, that’s for sure,” he said. You can see his full segment via CNBC’s coverage. He then framed the puzzle that markets keep ignoring: “Normally, equity prices correlate very well with confidence, and equity prices continue to flirt with history to the upside.”
The Spending Paradox
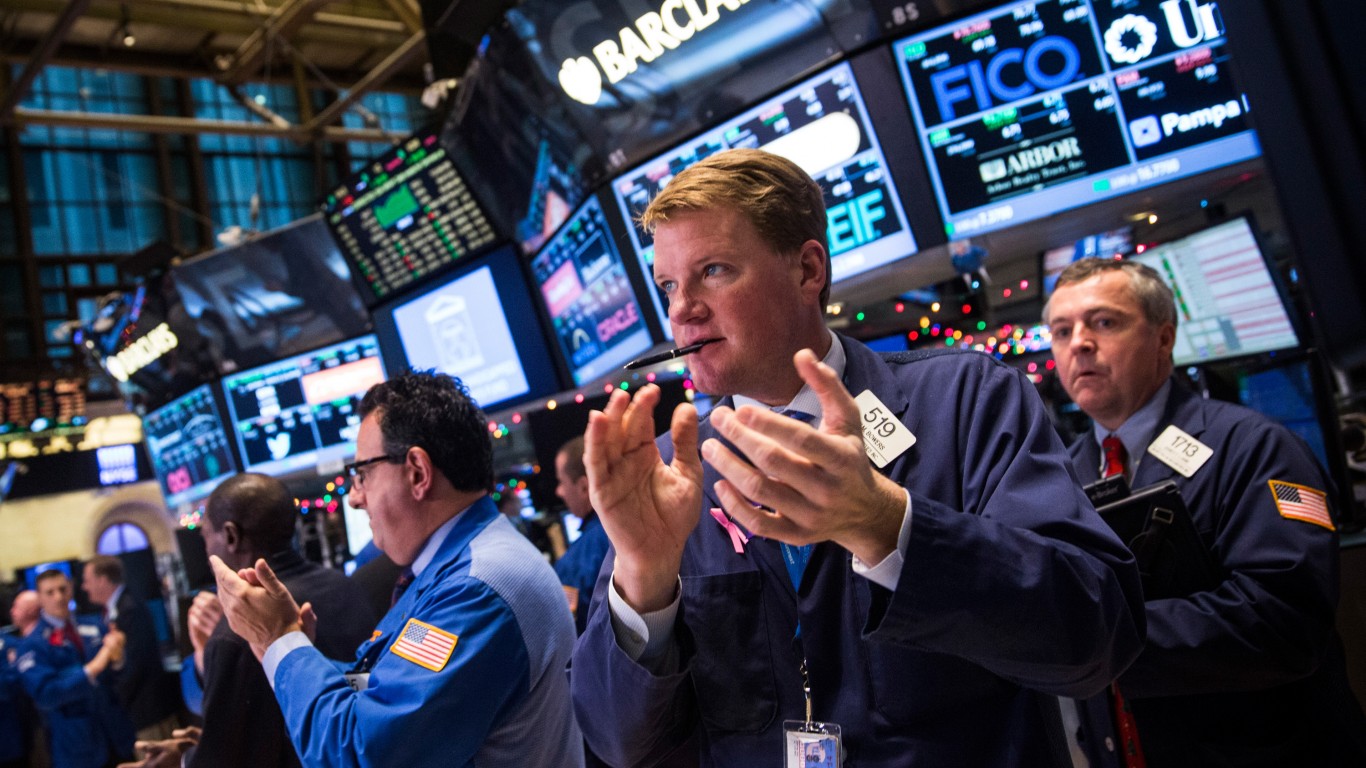
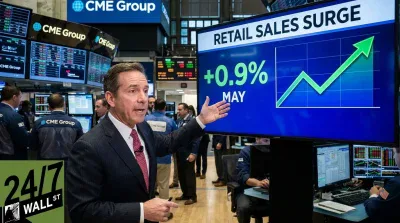
What’s holding the disconnect together is actual cash flow. Retail sales hit $757.1 billion in April, a fresh 12-month high and the 91st percentile of the range. Personal income reached $26.75 trillion in Q1. Consumers tell pollsters they’re miserable, then swipe the card anyway. The savings rate tells the cost: it has slipped from 5.2% in Q1 2025 to 4% in Q1 2026.
That is a K-shaped expansion in numbers. JP Morgan’s 2026 outlook describes it directly: a “K-shaped economy where middle-income and below consumers feel pressured and rate-sensitive sectors of the economy (like housing) remain soggy,” with stock-market wealth gains powering high-end spending while lower-tier balance sheets thin out.
Why Bond Traders Are Watching
Santelli’s home turf matters here, as the 10-year Treasury yield closed Wednesday at 4.57%, with a spike to 4.67% on May 19, the highest in 12 months and the 98th percentile of its range. Yields are pushing higher while the VIX has compressed to 16.76, down 14% over the past month. Bond markets are pricing in stress. Equity options markets are pricing in calm. One of them is wrong.
What To Watch
Consumer sentiment leads spending by one to three months, per the FRED interpretation framework. The April-to-May trajectory, from 49.8 to 44.8, would historically be the kind of move that bleeds into retail data by late summer. Vanguard’s 2026 outlook flags exactly this scenario: “Risks are growing amid this exuberance, even if it appears ‘rational’ by some metrics.”
Santelli’s 44.8 is the number that frames the second half of 2026. Either confidence catches up to prices (the bull resolution), or prices eventually catch up to confidence. Watch the inflation expectations print next month. If the one-year reading climbs past 5%, the Fed’s room to cut, already narrow per Vanguard’s 3.5% neutral rate estimate, gets narrower still.
Contact [email protected] for any questions or corrections.