Although Wall Street tends to treat record-setting streaks as a reason to brace for a pullback, the historical record points the other way this week. The benchmark S&P 500 just stitched together eight straight weekly gains, with a cumulative 8-week return of 17.3%, a run that independent market historian Ryan Detrick (@RyanDetrick on X) ranks as the second best 8-week rally in S&P 500 history.
The only stretch that beat it: a 17.4% 8-week rip in 1997. Today’s run missed the all-time crown by 0.1 percentage points, a margin so thin that for narrative purposes the two stretches sit side by side.
The backdrop helps to explain the move. The CBOE Volatility Index has drifted from 25.78 on April 7 down to 16.59 on May 25, and the SPDR S&P 500 ETF Trust (NYSEARCA:SPY) is up 30% over the past year. Fear has receded as the tape has climbed.
The 1997 Echo Is Hard to Ignore
What gives the current setup teeth is what followed the 1997 record. Per Detrick’s data, after that 17.4% 8-week stretch in 1997, the S&P 500 tacked on another 22% over the following year. That stretch arrived in the middle of one of the most powerful equity bull markets in postwar history.
The 1997 parallel is suggestive, not predictive. The macro backdrop then included different rates, different valuations, and a different geopolitical mix, so the comparison frames the question rather than answering it.
What History Says Comes Next
Detrick’s broader study, covering S&P 500 data from 1950 through the present time, tracks every prior 8-week win streak and measures what happened next. Those forward-return averages skew firmly to the upside.
After an 8-week win streak, the S&P 500 has averaged a gain of 2% over the next 4 weeks, 4% over the next 12 weeks, 7% over the next 26 weeks, and 17% over the next 52 weeks. Those numbers are the averages across every qualifying instance, not a forecast.
When the S&P 500 has strung together 8 straight weekly gains and the cumulative move topped 12%, the index has been higher one year later in every instance, with no exceptions. That is one of the cleanest continuation signals in Detrick’s data set.
The Political Backdrop
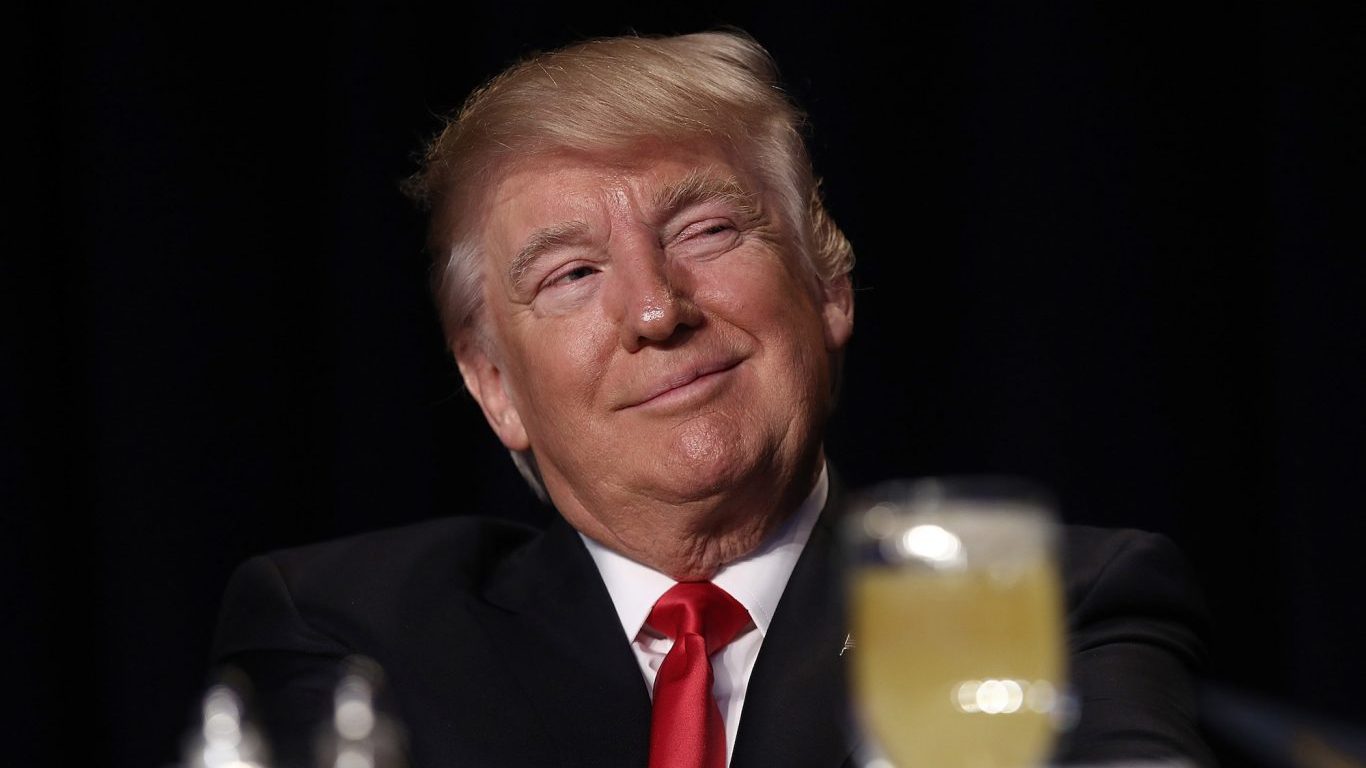
The rally is unfolding during the Trump administration, and the President frequently cites stock market performance as evidence of policy traction. The midterm elections are on the horizon, and a continuation of the move would line up with the administration’s market-focused messaging.
The macro plumbing has cooperated. The Federal Reserve has cut the federal funds rate by 75 basis points over the past year, holding the upper bound at 3.75% since December 10, 2025. The 10-year Treasury yield has climbed alongside the rally, sitting at 4.56% as of May 22, so equities have advanced despite rising long-end borrowing costs.
The yield curve, meanwhile, isn’t flashing recession. The 10-year minus 2-year spread closed at 0.49% on May 26, comfortably positive and well clear of inversion territory.
The Honest Caveats
The phrase “every instance” is doing a lot of work. The sample of 8-week rallies above 12% is small, and small samples can produce clean-looking patterns that don’t always travel. Past patterns don’t guarantee future returns.
There’s also a divergence worth watching. University of Michigan Consumer Sentiment printed at 49.8 in April, the lowest reading in the 12-month window and well into pessimistic territory. If the equity tape is sprinting while household confidence drags, the rally is running ahead of the consumer it ultimately needs.
For cautious investors, the takeaway is one of asymmetry rather than certainty. Detrick’s data shows that historically, mean reversion has rarely followed an 8-week, double-digit run; continuation has been the dominant outcome. The honest framing is that the long-term trend on Wall Street still heads higher in the decades to come, and this particular signal is one of the strongest postwar continuation tells on record, even if any single instance can range widely around the average.
Contact [email protected] for any questions or corrections.