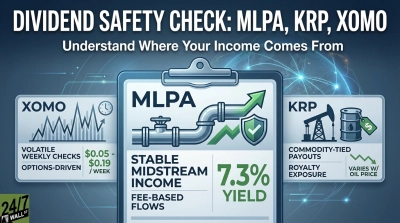
Global X MLP ETF (NYSEARCA:MLPA) pays quarterly cash distributions sourced almost entirely from operating cash flows of U.S. midstream master limited partnerships. Over the trailing four quarters, MLPA paid out $3.94 per share, which works out to roughly 7.4% on a recent price of $53. Income investors hold MLPA for that tax-advantaged payout. The real question is whether the pipelines, terminals, and processing assets underneath can sustain distributions of that size. The short answer: yes, with caveats tied to oil and policy.
How MLPA Turns Pipelines Into Quarterly Checks
MLPA tracks the Solactive MLP Infrastructure Index, a concentrated basket of mid and large-cap partnerships that gather, transport, store, process, and export U.S. hydrocarbons. The fund holds 20 positions with roughly $2.1 billion in net assets and charges a 0.8% expense ratio. Distributions flow up from the partnerships as quarterly cash, get netted against fund expenses, and land in shareholder accounts four times a year.
The durability of MLPA’s payout depends on its top holdings’ distributions. This fund is concentrated: the top five names account for roughly 62% of net assets. If those five cover their distributions with real distributable cash flow, MLPA’s payout is largely safe.
The Five Names That Decide the Distribution
- Energy Transfer at 14% is the single biggest swing factor. Its gas, crude, and NGL network produces distribution coverage typically running 1.8x to 2.0x, leaving cushion if one segment softens.
- Enterprise Products Partners at 14% has more than a quarter century of consecutive annual distribution increases and a fortress investment-grade balance sheet. Cash flow has comfortably exceeded distributions for years.
- MPLX at 13% benefits from Marathon Petroleum as anchor customer and has raised distributions at a double-digit clip, with coverage above 1.5x.
- Western Midstream at 11% is more Permian-levered and sensitive to producer drilling activity, but has consistently covered its base distribution and paid sizable enhanced distributions.
- Plains All American at 10% carries the most volume risk because crude gathering revenue rises and falls with Permian throughput, but management has kept coverage above 1.6x.
None of these five rank as fragile payers today. The 2020 distribution collapse that took MLPA’s payment down to $0.18 reflected weaker contract structures and a global demand shock. Today’s MLPs run lower debt and longer fee-based contracts.
Where the Real Risks Sit
Oil price is the obvious one. WTI traded at $98 on May 26 after touching $115 in April, with a 12-month low of $55. Most midstream revenue is fee-based, but producer activity and volumes through pipes still track the commodity. A sustained drop below $60 would pressure coverage at volume-sensitive holdings.
Policy risk matters too, per the fund’s underlying exposure to mid-cap MLPs subject to refinery capacity constraints, federal permitting, and legislative changes. Permitting reform, pipeline approvals, and the tax treatment of partnership structures sit on the political dial. Refinery and export logistics, particularly Gulf Coast LNG capacity feeding Cheniere Energy Partners at 7% of the fund, can bottleneck cash flow if buildout slows.
Yield Versus Total Return
MLPA has delivered: up 16% over the past year, 14% year to date, and 110% over five years on a total-return basis. That trounces the 4.5% ten-year Treasury and means investors have collected the distribution without giving back NAV.
The Verdict
MLPA’s distribution looks safe through 2026. Payments have ratcheted up four years running, from $0.725 quarterly in 2021 to $1.02 in May 2026, supported by improving coverage at the partnerships that drive 62% of the portfolio. The fund suits retirees and taxable-account income investors who want energy infrastructure cash flow and can tolerate K-1 tax filings. Investors who cannot stomach a 30% drawdown if oil collapses, or who want a 1099 rather than a K-1, should consider Alerian MLP ETF (NYSEARCA:AMLP | AMLP Price Prediction) for similar exposure or a midstream C-corp fund that swaps some yield for simpler taxes.