The market has a way of pretending it has seen everything — until it hasn’t. Stocks sit near record territory, liquidity is still abundant by historical standards, and yet the Federal Reserve is once again trying to thread a very narrow needle: cool inflation without cracking growth. The current federal funds rate, sitting around 3.64% according to Federal Reserve Economic (FRED) data, puts policy in a zone that feels familiar but isn’t comfortable.
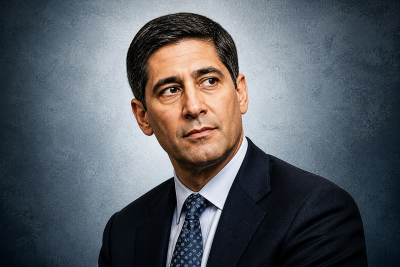
Here’s the tension investors are wrestling with: can the economy absorb tighter financial conditions while $8.6 trillion in aggregate market value hangs in the balance of policy interpretation alone? That’s the backdrop as Kevin Warsh has stepped in as Federal Reserve chair in what may become the most closely watched “soft landing” attempt since the early 2000s.
The real question is, has the stock market truly been here before, or is this a rerun with higher stakes and fewer safety nets?
The Only True Comparison: 2001’s Pre-Recession Tightrope
If you’re looking for historical parallels, there’s really only one that comes close. In August 2001, the effective federal funds rate hovered near 3.65%, just before the economy slipped into recession later that year.
That period matters because it wasn’t just about rates — it was about timing. Policy was tight enough to slow demand, but not tight enough to immediately signal distress. That’s the same delicate positioning investors are trying to decode today.
Let’s compare the setups:
| Metric | 2001 Cycle | 2026 Cycle |
| Fed Funds Rate | ~3.65% (FRED) | ~3.64% (FRED) |
| S&P 500 Forward P/E | ~19.5x (S&P Global data) | ~21.2x (FactSet consensus) |
| Tech Weight in S&P 500 | ~14% | ~31% |
| Market Sensitivity to Rates | Moderate | Elevated due to duration-heavy equities |
Surprisingly, the biggest difference isn’t the rate level — it’s composition. Today’s index is far more concentrated in long-duration growth assets, meaning every 25-basis-point shift in discount expectations hits valuations harder than it did two decades ago.
That’s the “hidden lever” Warsh is dealing with. And it’s why this doesn’t feel like a standard cycle.
The $8.6 Trillion Question: Liquidity Meets Policy Reality
This is Warsh’s $8.6 trillion moment of truth. That figure reflects the combined equity market capitalization most sensitive to rate expectations across U.S. large-cap indices and rate-duration-sensitive sectors.
Here’s where potential problems start cropping up:
- Mega-cap tech stocks (Microsoft (NASDAQ:MSFT | MSFT Price Prediction), Apple (NASDAQ:AAPL), Nvidia (NASDAQ:NVDA), Amazon (NASDAQ:AMZN)) collectively trade at forward P/Es between 22x and 37x, according to FactSet estimates.
- S&P 500 ex-tech trades closer to 16.8x forward earnings.
- The spread between the two — roughly 1.8x valuation divergence — is historically wide by post-2010 standards.
Granted, high valuations alone don’t trigger market corrections. Cash flow does. And here, the S&P 500 still generates roughly $2.9 trillion in trailing 12-month operating earnings. But the sensitivity to discount rates is the issue.
At the end of the day, even a modest shift in rate expectations — for example, 50 basis points over 12 months — can compress equity valuations by 8% to 12% in rate-sensitive sectors, based on historical regression models.. That’s the landing strip Warsh is trying to line up.
Can the Market Actually Stick the Landing?
Investors don’t need perfection. They need stability in expectations. The problem is that stability has been in short supply since inflation first surged above target in 2022.
If policy holds steady near current levels and earnings growth remains in the projected 6% to 8% range, markets can probably absorb the rate environment. If not, duration-heavy equities will do the adjusting first — and fastest. FactSet projects the S&P 500 will grow earnings 22.6%. That will slow to 14.7% next year, but both remain extremely elevated compared to the historical 8.6% average.
That said, this is not a binary outcome. It rarely is.
Key Takeaway
In short, the market has been in a similar rate environment once before — but never with today’s valuation structure layered on top. That combination is what makes Warsh’s task feel less like steering and more like landing a wide-body jet in crosswinds.
For investors, the signal is simple: watch rate expectations, not just rate levels. Because in this cycle, the direction of travel matters more than the altitude.