Kevin Warsh’s $8.6 Trillion Moment of Truth
The stock market has spent much of 2026 climbing a wall of worry. Artificial intelligence is reshaping industries, corporate earnings continue to surprise to the upside, and the S&P 500 keeps pushing deeper into record territory. Yet beneath the surface,…

The stock market has spent much of 2026 climbing a wall of worry. Artificial intelligence is reshaping industries, corporate earnings continue to surprise to the upside, and the S&P 500 keeps pushing deeper into record territory. Yet beneath the surface, investors face a familiar question: Is the Federal Reserve already behind the curve?
That question matters because history rarely repeats perfectly, but it often rhymes. Today’s effective Federal Funds Rate sits at 3.64%, according to Federal Reserve Economic Data (FRED). Surprisingly, there is only one period in modern history when rates were nearly identical: August 2001, when the Federal Funds Rate stood at 3.65%.
The similarities between then and now are difficult to ignore. The internet was transforming the economy in 2001. Artificial intelligence is doing the same in 2026. Unemployment stood at 4.9% then. It sits at 4.2% today, according to the Bureau of Labor Statistics June 2026 Employment Situation report. And just as investors were convinced technology would power years of growth in the early 2000s, today’s market has become increasingly dependent on AI-related optimism.
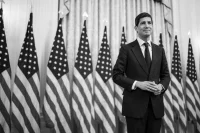
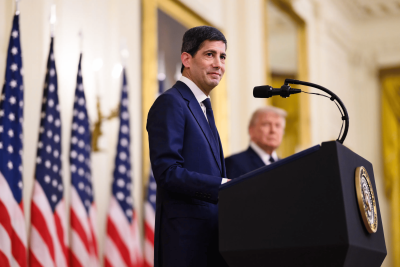
The question facing Federal Reserve Chair Kevin Warsh is whether policymakers have learned the lessons of 2001.
The Last Time Rates Were Here
According to FRED data, the Fed lowered interest rates by 25 basis points in August 2001 and followed with a larger 50-basis-point cut in September. Those moves were part of a broader easing cycle that had already been underway throughout the year.
Yet the cuts failed to prevent market losses. The S&P 500 finished 2001 down roughly 12%. By the time the Fed was cutting aggressively, the economic slowdown and collapse of technology valuations were already taking their toll.
Today’s economy is not identical to 2001. Corporate balance sheets are stronger, banks are better capitalized, and AI is creating tangible productivity gains across industries. But the lesson remains relevant: monetary policy works with a lag, and waiting too long can make eventual rate cuts less effective.
© 24/7 Wall St.
The AI Boom’s Hidden Vulnerability
The market’s concentration creates an added risk. A significant portion of the S&P 500’s gains over the past two years has come from a relatively small group of AI-linked companies. Leaders such as NVIDIA (NASDAQ:NVDA | NVDA Price Prediction | NVDA Price Prediction), Microsoft (NASDAQ:MSFT), and Broadcom (NASDAQ:AVGO) have accounted for an outsized share of index performance.
That concentration cuts both ways. If economic growth slows more than expected or investors begin reassessing AI-related valuations, the downside could be amplified quickly. With the S&P 500’s market capitalization now exceeding $72 trillion, a 12% decline similar to 2001 would erase approximately $8.6 trillion in shareholder wealth.
That is not a theoretical number. It represents retirement accounts, pension funds, college savings plans, and investment portfolios across the country. The stakes are far higher today simply because the market itself is so much larger than it was a generation ago.
Why Warsh Faces a Defining Decision
Warsh has built a reputation as someone willing to challenge conventional thinking. As the new Fed chairman, one of his first major tests involves determining whether policy remains too restrictive for an economy showing signs of cooling. His agenda already reflects that ambition: in June 2026, Warsh announced five task forces to conduct a sweeping review of Fed communications, its $6.7 trillion balance sheet, the data it relies on, its inflation framework, and the economic impact of new technologies such as AI. The groups, which include prominent academics, former central bankers, and business leaders, are expected to deliver recommendations by year-end.
On the inflation front, the picture has shifted materially since this article was first published. Headline CPI ran at 3.8% in April and surged to 4.2% in May before falling sharply to 3.5% in June 2026 as energy prices plunged following a ceasefire between the US and Iran. Core CPI (excluding food and energy) eased to 2.6% year-over-year in June, below the 2.9% reading in May. While the trend is encouraging, inflation remains well above the Fed’s 2% target, and Warsh himself cautioned against complacency after the June report, saying the data should not be read as “mission accomplished.” Higher borrowing costs continue to pressure housing, commercial real estate, and small-business lending.
The balancing act is stark. Move too slowly, and economic weakness could spread before rate cuts gain traction. Move too aggressively, and a renewed inflation surge becomes the risk. The FOMC voted 12-0 to hold rates steady at its June 17 meeting, its fourth consecutive hold, and the Fed’s latest dot plot shows most officials expecting the benchmark rate to finish 2026 between 3.6% and 4.1%, up from prior projections. The Fed’s margin for error is shrinking.
Key Takeaway
The current effective Federal Funds Rate of 3.64% places investors in remarkably familiar territory. The last time rates were this close to today’s level was August 2001, just before the Fed accelerated rate cuts as the economy weakened and the S&P 500 ultimately lost 12%.
History does not guarantee the same outcome in 2026. AI may prove more durable than the internet boom of the early 2000s, and corporate fundamentals remain largely healthy. But the lesson from 2001 is straightforward: rate cuts work best before economic weakness becomes obvious.
For Warsh, that makes the coming months a genuine moment of truth. If policymakers wait too long, the cost could be measured not in basis points, but in trillions of dollars.
Editor’s note: This update corrects the unemployment rate to 4.2% (June 2026, per the Bureau of Labor Statistics), refreshes the inflation figure to 3.5% CPI for June 2026 (down from 4.2% in May), and adds context on Warsh’s five monetary policy task forces announced in June and July 2026, as well as the FOMC’s unanimous June 17 hold decision and the revised dot-plot projections for year-end rates.
Contact [email protected] for any questions or corrections.
After two decades of patrolling the dark corners of suburbia as a police officer, Rich Duprey hung up his badge and gun to begin writing full time about stocks and investing. For the past 20 years, he’s been cruising the markets looking for companies to lock up as long-term holdings in a portfolio while writing extensively on the broad sectors of consumer goods, technology, and industrials. Because his experience isn’t from the typical financial analyst track, Rich is able to break down complex topics into understandable and useful action points for the average investor. His writings have appeared on The Motley Fool, InvestorPlace, Yahoo! Finance, Money Morning, and, of course, 24/7 Wall St. He has been featured in both U.S. and international publications, including MarketWatch, Financial Times, Forbes, Fast Company, and USA Today.