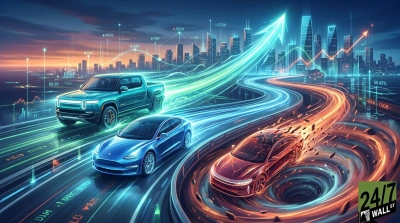
Tesla (NASDAQ: TSLA | TSLA Price Prediction) and Rivian (NASDAQ: RIVN) both posted Q1 2026 results that beat Wall Street estimates, yet the businesses underneath are on opposite ends of the EV maturity curve.
Tesla flexed margin expansion and AI ambition. Rivian leaned on partnerships and a fresh product launch to bridge to profitability. Comparing them now, with R2 shipping and Robotaxi rides live in Texas, finally feels useful.
Margins Carry Tesla. R2 Carries Rivian.
Tesla pulled in $22.387 billion in revenue, up 15.78% YoY, with automotive gross margin expanding to 21.1% from 16.2%. Lower material costs, a higher average selling price, and a roughly $0.9 billion FX tailwind did the heavy lifting. Services and Other revenue jumped 42% as active FSD subscriptions hit 1.28 million, up 51%. Software is becoming a real, material line item.
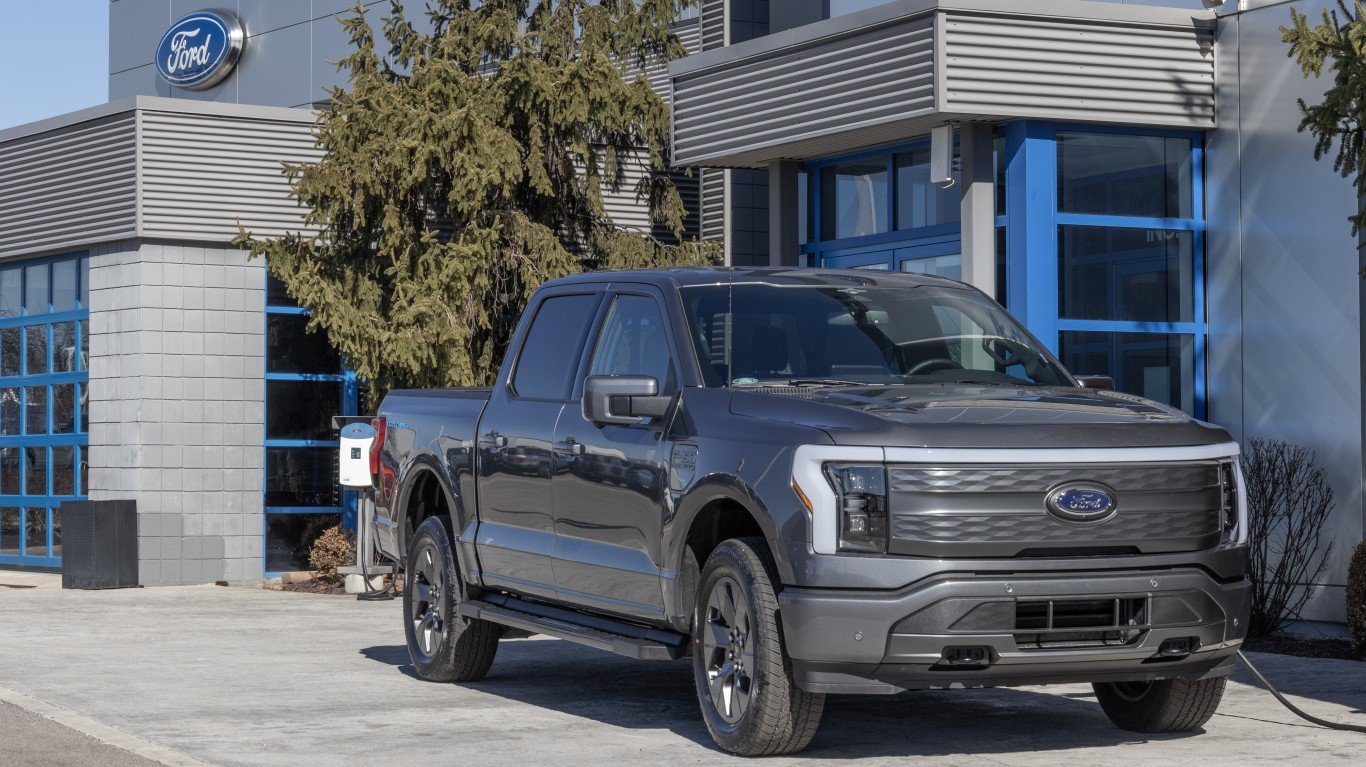
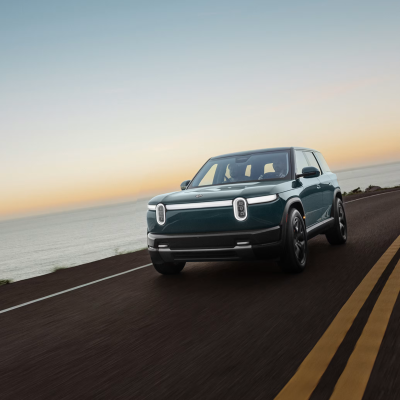
Rivian delivered 10,365 vehicles, a 20% jump, and revenue of $1.381 billion. The catch: the automotive segment swung to a $62 million gross loss from a $92 million profit a year earlier, hurt by a $100 million drop in regulatory credits and a heavier commercial van mix.
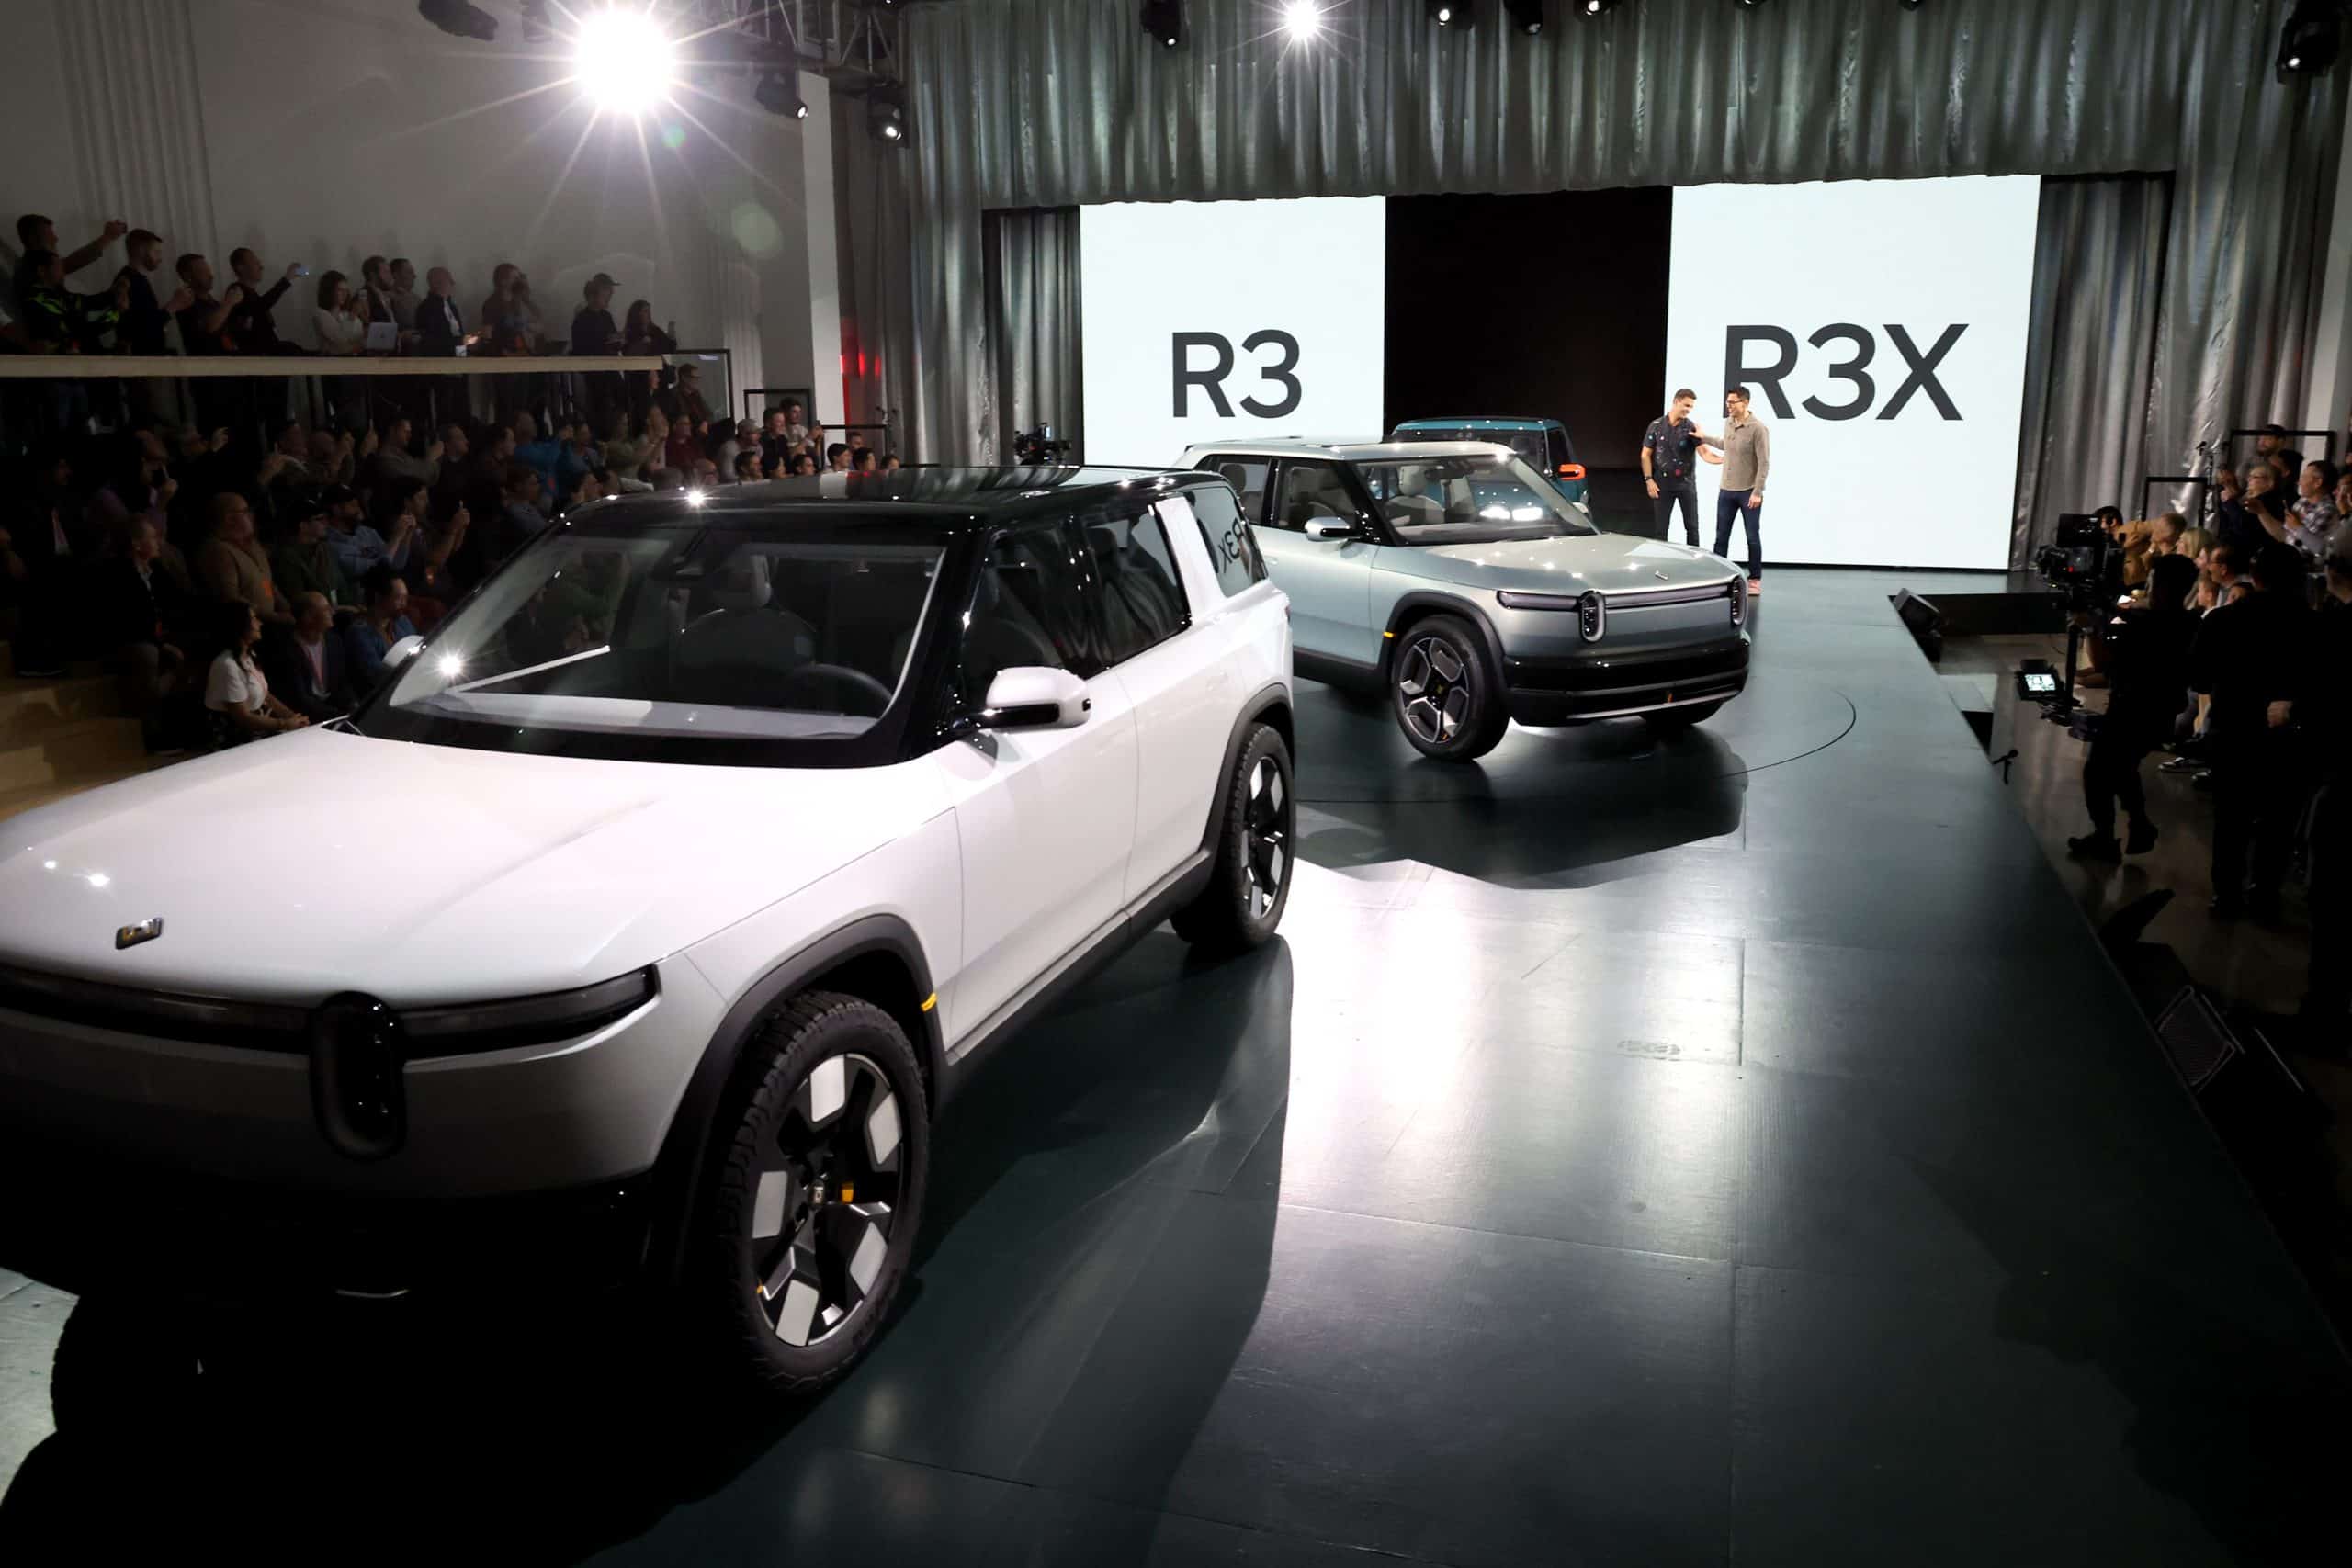
Software and Services climbed 49% to $473 million, almost entirely thanks to the Volkswagen joint venture work. CEO RJ Scaringe framed the quarter around the R2 launch and the $4.5 billion DOE loan for the Georgia plant.
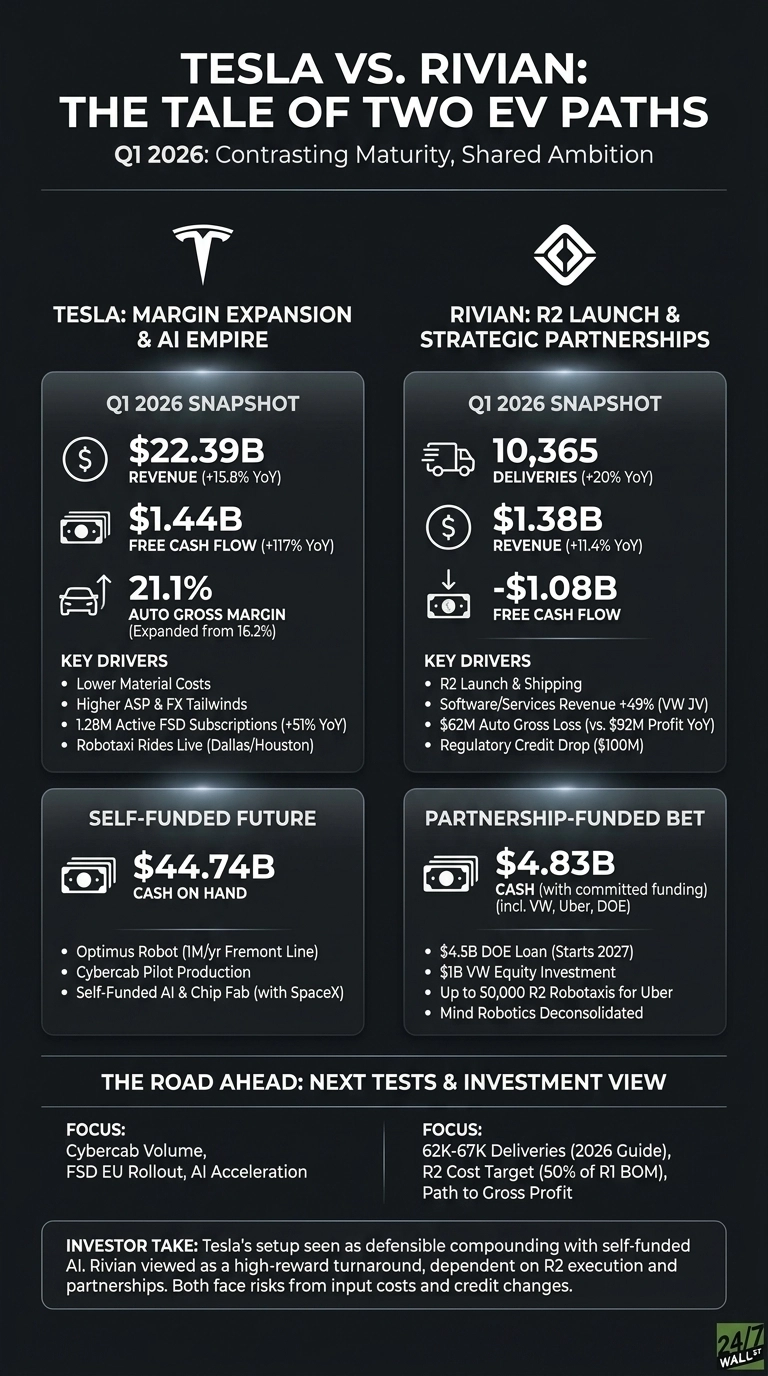
Self-Funded Empire vs. Partnership-Funded Bet
| Lens | Tesla | Rivian |
| Cash on hand | $44.74B | $4.83B (with committed funding) |
| Q1 Free Cash Flow | +$1.44B | -$1.08B |
| Autonomy bet | FSD + Robotaxi in Dallas/Houston | Up to 50,000 R2 robotaxis for Uber |
| Robotics bet | Optimus (1M/yr Fremont line) | Mind Robotics (deconsolidated) |
Tesla is building its own semiconductor fab with SpaceX and ramping LFP cells in Nevada.
Rivian is leaning on a $1 billion VW equity check, a $1.25 billion Uber commitment through 2031, and a DOE loan that does not start drawing until early 2027. Two very different risk profiles.
The Next Test Is R2 Volume and FSD Conversion
Rivian guided to 62,000 to 67,000 deliveries and adjusted EBITDA between -$2.10 billion and -$1.80 billion. The R2 bill of materials is expected to land at roughly 50% of R1, which is the entire profitability thesis.
Tesla offered no formal guidance, but Cybercab pilot production, Megapack 3, and the EU rollout of FSD are the catalysts I am tracking. Prediction markets currently skew toward a strong Q2 delivery print.
Why I Lean Tesla for Compounding, Rivian for the Lottery Ticket
Personally, I find Tesla’s setup more defensible. A 345 trailing P/E is uncomfortable, and the stock is down 8.42% year to date, but the combination of expanding auto margins, growing FSD subscriptions, and a self-funded AI roadmap is hard to replicate.
Rivian intrigues me as a turnaround. Shares trade near $16.81, and if R2 hits its cost targets, the upside is large. I would still want one clean quarter of automotive gross profit before sizing it as anything more than a speculative slice. If input costs spike or EV credits get cut, I would step back from both.
Contact [email protected] for any questions or corrections.