Owning individual U.S. cannabis operators means wrestling with OTC-listed tickers, thin liquidity, and a patchwork of state licenses that most brokerage screeners barely index. The AdvisorShares Pure US Cannabis ETF (NYSEARCA:MSOS) exists to collapse that mess into one ticker. For a retirement-skewing investor who wants a small speculative dose of the U.S. multi-state operator (MSO) trade without opening a special OTC account, MSOS is the closest thing to a turnkey vehicle. The catch is that the plumbing inside MSOS is more exotic than a typical sector ETF, and the ride has been brutal for anyone who bought it as a long-term hold.
What MSOS Actually Owns
Because cannabis remains federally illegal, MSOS cannot hold shares of U.S. plant-touching operators directly. Instead, the fund uses total-return swaps with counterparties, including Nomura and Cantor Fitzgerald, to replicate the economics of owning those stocks. The direct equity book is smaller than most holders realize: roughly 15% of net assets is in cannabis equities, with the remainder in short-term Treasury instruments and derivative exposure.
Concentration is the other headline. The top three holdings (Curaleaf, Trulieve, and Green Thumb) combine for about 65% of net assets. A BlackRock Treasury Trust position holds another 7%, providing liquidity for redemptions and swap collateral. Total fund AUM (assets under management) is approximately $990 million, which is meaningful scale for a niche wrapper.
Does the Promise Match the Results?
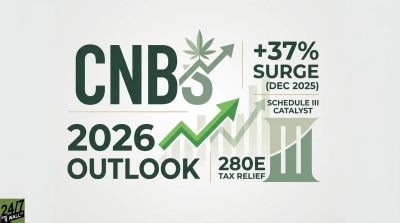
Performance depends entirely on the window. Over the past year, MSOS is up roughly 111%, from $2.41 to $5.08, driven by the president’s December 2025 executive order to begin the process of rescheduling cannabis to Schedule III. Stretch the lens and the picture inverts: shares are down more than 87% over five years, meaning anyone who bought the 2021 peak still owns roughly a dime on the dollar.
Portfolio manager Dan Ahrens has been candid that “the sector moves primarily on regulatory announcements from Washington rather than company fundamentals.” That is a fair description of what a holder is buying: a leveraged bet on federal policy movement, wrapped in a listed ticker.
Three Tradeoffs Worth Pricing In
- Counterparty risk from swaps. The swap structure means holders depend on the creditworthiness and willingness of Nomura, Cantor Fitzgerald, and others to continue writing exposure. Any pullback in bank appetite for cannabis derivatives can widen tracking error or force position unwinds.
- Regulatory whipsaw. The same headline sensitivity that produced the one-year rip also produced a 26% drop in a single month in January 2026 when the follow-through stalled. Two-way volatility is the norm.
- Top-heavy book. With Curaleaf near 25% of assets, a single operator’s balance sheet stumble drags the whole fund. Diversification across 27 positions is less than it sounds when the tail is tiny.
Where MSOS Fits, and Where It Does Not
For a cautious investor who wants to participate in a potential U.S. cannabis re-rating without stock-picking OTC operators, MSOS works as a small speculative sleeve, roughly 1% to 3% of a diversified portfolio, with the understanding that the position may swing 20% in a month on policy news. It is the cleanest single-ticker expression of the trade, and 24/7 Wall St.’s prior survivor review of this ETF and its cannabis-ETF peers reached a similar conclusion on liquidity and structure. Anyone treating it as a core equity holding, or expecting the five-year chart to heal quickly, may want to think again. Sizing discipline is the entire game here.
Contact [email protected] for any questions or corrections.