Nvidia vs. Apple: The Battle for Tech’s Most Valuable Crown
Nvidia and Apple both shattered expectations this quarter, but they are playing completely different games. Which business model actually wins as AI spending reshapes the entire tech landscape?

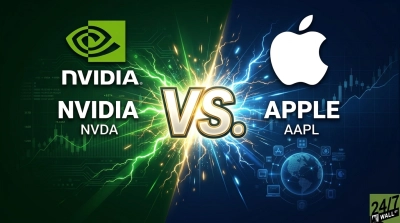
NVIDIA (NASDAQ:NVDA | NVDA Price Prediction) and Apple (NASDAQ:AAPL) just delivered earnings that frame the two dominant bets in tech today.
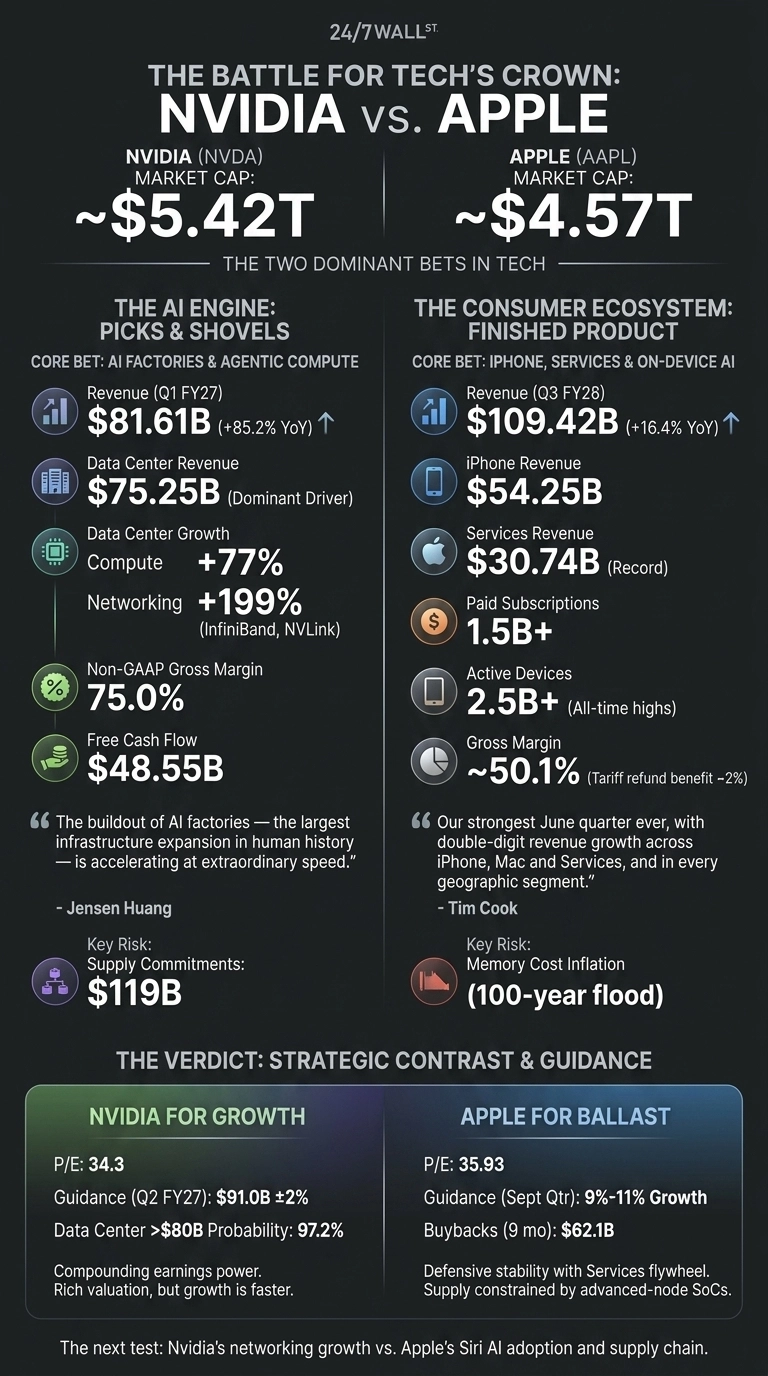
Nvidia posted $81.61B in Q1 FY27 revenue with Data Center at $75.25B. Apple countered with $109.4 billion in Q3 FY26 revenue and its strongest June quarter ever. One sells the shovels. The other sells the finished product.
AI Factories Carry Nvidia. iPhone and Services Carry Apple.
Nvidia’s quarter was almost entirely a Data Center story. Compute rose 77% and networking, powered by InfiniBand, NVLink and Spectrum-X, jumped 199%. Jensen Huang told investors “the buildout of AI factories, the largest infrastructure expansion in human history, is accelerating at extraordinary speed.”
Hyperscalers still represent roughly 50% of that segment, with sovereign AI programs and enterprise deployments filling in behind them. Non-GAAP gross margin hit 75%, and free cash flow reached $48.55B.

Apple’s engine looked different. iPhone revenue climbed to $54.252 billion, Services set a June quarter record at $30.7 billion, and paid subscriptions crossed 1.5 billion.
Tim Cook called it “our strongest June quarter ever, with double-digit revenue growth across iPhone, Mac and Services, and in every geographic segment.” A tariff refund added roughly 2 percentage points to gross margin and $0.11 to EPS, which is a one-time gift worth remembering.

Picks and Shovels vs. the Consumer Ecosystem
| Lens | NVIDIA | Apple |
| Core Bet | AI factories, agentic compute | iPhone cycle, Services, on-device Siri AI |
| Growth Rate | +85.2% YoY revenue | +16.36% YoY revenue |
| Gross Margin | ~75% non-GAAP | ~50.1% |
| Key Vulnerability | China export controls, zero H20 revenue | Memory cost inflation, tariff policy |
Nvidia is scaling Blackwell 300, Vera Rubin and BlueField-4 into every hyperscaler and sovereign AI cluster. Apple is monetizing an installed base above 2.5 billion active devices while rolling out Siri AI to WWDC26 developers.
Cook framed the differentiator as “the unique combination of massive unified memory bandwidth, industry-leading power-efficient performance, and deep on-device intelligence.”
Kevan Parekh flagged a “100-year flood on the memory pricing” that could pressure September quarter margins to 47%-48%. Nvidia has its own supply worry: $119B in purchase commitments tied to TSMC capacity.
The Next Test Is Guidance
Nvidia guided Q2 FY27 to $91B in revenue, excluding any China Data Center compute. Prediction markets on Polymarket now imply a 97.2% probability that Data Center clears $80B, but only 19.5% for $90B. That is a narrow beat lane.
Apple guided September quarter growth of 9%-11%, constrained by advanced-node SoC supply that Cook attributed to “a demand forecast issue” rather than a shortage. I want to see whether Siri AI actually pulls subscribers up the iCloud+ stack, and whether Nvidia’s networking growth holds once Blackwell shipments normalize.
Why I Lean Nvidia for Growth, Apple for Ballast
If I had to pick one, I would still tilt toward Nvidia for the growth sleeve. A P/E of 34 against +85% revenue growth and 75% margins looks rich, yet the earnings power is compounding faster than the multiple.
Apple, trading at a P/E of 36, fits the defensive investor better. The $62.094 billion in nine-month buybacks and the Services flywheel offer stability that Nvidia cannot match. If memory costs stay elevated into 2027, or China export rules loosen for H20, my ranking could flip fast.
Contact [email protected] for any questions or corrections.
Vandita Jadeja is a financial publisher with over a decade of experience writing about financial topics, including investment, savings, retirement, insurance and banking. Vandita is a Chartered Accountant who loves to debunk financial concepts for readers.
Her work has appeared on sites that include The Motley Fool, InvestorPlace, and Benzinga. She covers investing and focuses on stock picks and price prediction for 24/7 Wall St.
When not looking for the next stock investment opportunity, she can be found traveling, reading, chasing sunsets and enjoying her iced latte.