Procter & Gamble vs PepsiCo: The Better Stock For Passive Income Investors
PepsiCo (NASDAQ: PEP | PEP Price Prediction) and Procter & Gamble (NYSE: PG) both just handed investors fresh earnings, and the businesses behind the tickers are steering in noticeably different directions. Pepsi posted Q2 2026 results on July 8 with…


PepsiCo (NASDAQ: PEP | PEP Price Prediction) and Procter & Gamble (NYSE: PG) both just handed investors fresh earnings, and the businesses behind the tickers are steering in noticeably different directions.
Pepsi posted Q2 2026 results on July 8 with international momentum leading the way. P&G’s fiscal Q3 earnings report landed in late April, driven by Beauty. Both beat, both reaffirmed guidance, and both are wrestling with tariffs.
Snacks Wobble at Pepsi. Beauty Powers P&G.
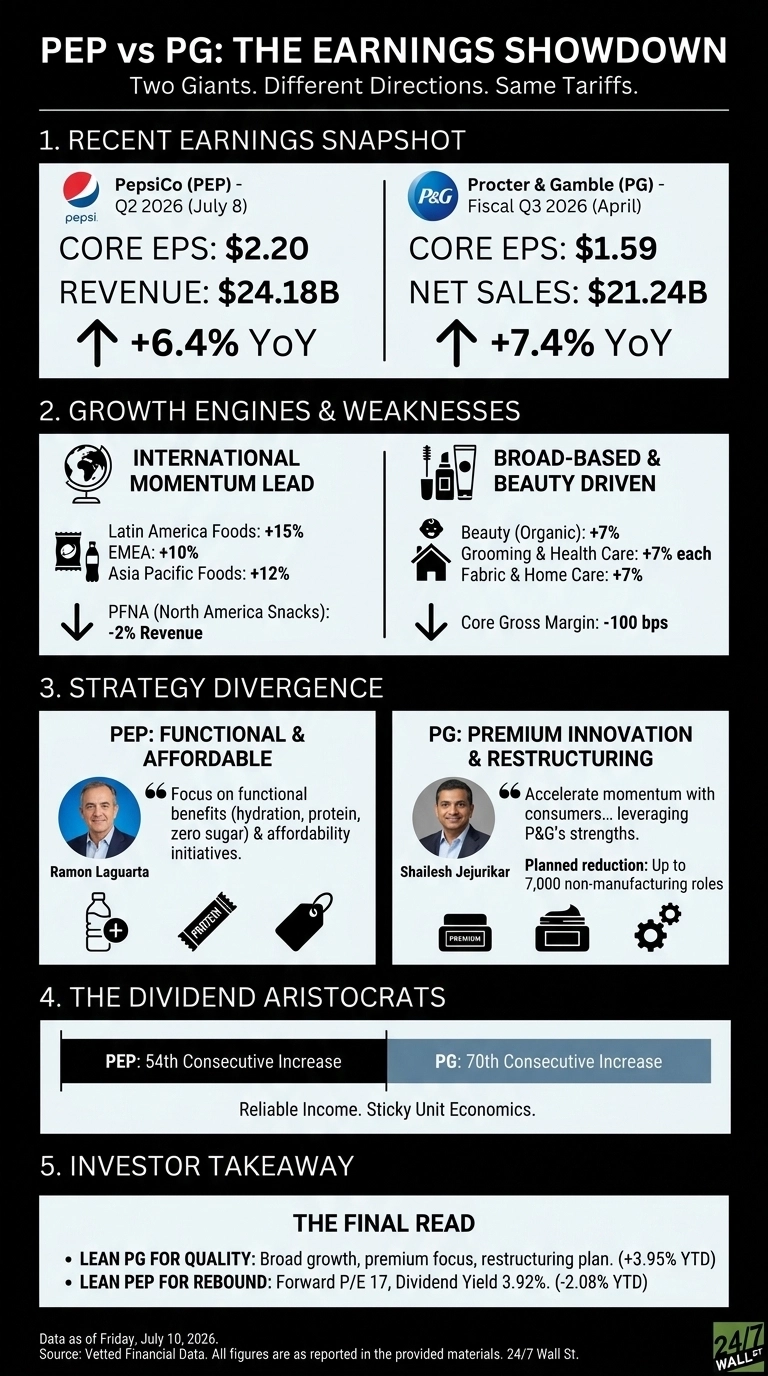
Pepsi delivered core EPS of $2.20 on $24.18 billion in revenue, up 6.4% year over year. The tell was geography. Latin America Foods jumped 15%, EMEA rose 10%, and Asia Pacific Foods climbed 12%, while PepsiCo Foods North America slipped 2% on lower effective net pricing.
That is a real business problem for Frito-Lay economics at home, even as CEO Ramon Laguarta pointed to “the highest rate [of global organic volume growth] since 2022”.

P&G’s story was different in texture. Net sales of $21.24 billion grew 7.4%, with Beauty up 7% organically on Hair Care, Skin Care, and Olay premiumization. Every one of the five segments grew. Core EPS came in at $1.59, beating the $1.5552 consensus. New CEO Shailesh Jejurikar framed it plainly: “broad-based growth across product categories and regions.”
| Business Driver | PepsiCo | P&G |
| Main Growth Engine | International beverages and foods | Beauty and premium innovation |
| Soft Spot | PFNA (-2%) | Fabric & Home Care organic (+3%) |
| Margin Move | Core margin -40 bps | Core gross margin -100 bps |
Functional Beverages vs. Premium Skin Care
Laguarta wants Pepsi’s portfolio pulled toward “functional benefits such as hydration, protein and fiber, energy and zero sugar beverage varieties“, alongside affordability initiatives to shore up domestic snacks.

Jejurikar is doing something bolder on the cost side. P&G announced a plan to cut up to 7,000 non-manufacturing roles by end of FY2027 while pushing innovation-based pricing in Oral Care and Skin Care.
Both companies get hit by tariffs. P&G quantified the pain at roughly $400 million after-tax and now expects results toward the lower end of its FY26 EPS range of $6.83 to $7.09. Pepsi, by contrast, reaffirmed core constant currency EPS growth of 4% to 6% and $8.9 billion in total shareholder returns.
The Next Test Is Domestic Snack Pricing and Tariff Absorption
I want to see whether Pepsi can stop the pricing bleed in Frito-Lay without gutting margin, and whether poppi, Gatorade, and the zero sugar push can keep offsetting soft PFNA.
For P&G, the tell will be Beauty holding a 7% organic pace while restructuring hits and tariff costs stay sticky. The 70th consecutive dividend increase and Pepsi’s 54th look secure; the unit economics behind them are the open question.
Why I Lean P&G for Quality, Pepsi for the Rebound Trade
If I want the cleaner operating story right now, I lean toward P&G. Every segment grew, Beauty is doing real premium work, and Jejurikar’s cost plan gives me a lever if tariffs stay elevated. The stock reflects it: PG is up 3.95% year to date, while PEP sits down 2.08%.
If I want more upside variance, Pepsi is the more interesting file. A forward P/E of 17 and 3.92% dividend yield pay me to wait while PFNA stabilizes. I would not chase either aggressively until I see two more quarters of margin direction. That is the read.
Contact [email protected] for any questions or corrections.
Vandita Jadeja is a financial publisher with over a decade of experience writing about financial topics, including investment, savings, retirement, insurance and banking. Vandita is a Chartered Accountant who loves to debunk financial concepts for readers.
Her work has appeared on sites that include The Motley Fool, InvestorPlace, and Benzinga. She covers investing and focuses on stock picks and price prediction for 24/7 Wall St.
When not looking for the next stock investment opportunity, she can be found traveling, reading, chasing sunsets and enjoying her iced latte.