





Visa (NYSE:V | V Price Prediction) stands as a nearly $700 billion payments giant poised for continued long-term growth. The company’s payments network touched 69.4 billion processed transactions in the quarter, yet it also sits on top of three earlier quarterly provisions of $899 million, $615 million, and $992 million. The disruption story at Visa is showing up quarter after quarter, in cash. This past quarter alone, Visa booked a $707 million litigation provision, which has some investors concerned.
But should they be?
What It Means
Visa is still a cash machine. Fiscal Q1 2026 net revenue came in at $10.90 billion, up 14.6% year over year, with non GAAP EPS of $3.17 beating the $3.1423 estimate. Net income came in at $5.853 billion, and cross border volume excluding intra Europe rose 11%, while data processing revenue climbed 17% to $5.544 billion.
The pressure sits beneath that. Full year FY2025 revenue rose 11.34% to $40 billion, but net income advanced only 1.6% to $20.058 billion. That is margin compression at a company built on operating leverage. In Q1 FY26, non GAAP operating expenses grew 16%, faster than net revenue. The $707 million interchange provision explains part of the gap. The rest is spending to defend a network under attack from stablecoins, real time rails, domestic wallets, and agentic commerce.
Market Reaction
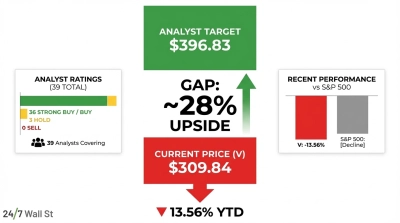
Shares of Visa stock closed at $326.37 the day of the Q1 FY26 filing and traded at $362.13 on July 2, 2026. Year to date, Visa is up 3.68% against the S&P 500 tracker SPY at 9.22%. Over one year, Visa returned 3.04% versus 20.04% for SPY. The stock is trailing the index it usually rides.
Bear Case
The bear case centers on a widening gap between top line growth and bottom line growth, and the reasons that gap is opening.
First, litigation is a recurring line item. Four consecutive quarters of interchange MDL provisions of $992 million, $615 million, $899 million, and $707 million point to a settlement structure that keeps taking bites out of the company’s GAAP earnings. Merchant challenges to interchange are one of the risks Visa flags directly in its filings, alongside complex and evolving global payments regulations, government imposed restrictions on international payments systems, and continued push to lower acceptance costs.
Second, competition is arriving on multiple fronts at once. CEO Ryan McInerney told analysts that “there will be more competition in Europe and globally, including domestic digital wallets and initiatives like Wero and a potential digital euro.” Stablecoin card programs are growing, with volume up nearly 200% year over year in Q2. Visa is positioning as a bridge layer, but bridge economics are not the same as toll booth economics.
Third, the market is charging Visa a full price for a slowing story. The company’s trailing PE ratio sits at 31, its forward PE is 23, and its price to sales sits at 15.52. Reddit chatter has already zeroed in on the valuation question, with a recurring thread noting Visa and Mastercard “both trading at 28x PE TTM” and sentiment cooling from bullish scores of 62 to 72 in mid June to neutral 50 to 58 by late June.
Fourth, capital return is doing heavy lifting. Visa repurchased roughly 11 million shares at an average price of $342.13 in Q1 FY26, spending $3.8 billion, with $21.1 billion remaining on the authorization as of December 31, 2025. Buybacks flatter EPS – they do not answer whether the interchange model survives the next decade intact.
Bottom Line
For long term holders, the question is whether Visa’s payments empire is compounding at the pace the multiple implies. FY2025 said no, as revenue grew 11.34% and net income grew 1.6%.
Now, the company’s Q1 FY26 results suggest Visa’s revenue engine still works, and the litigation and expense drags still bite. Analysts remain constructive with an average target of $398.7, but the stock is lagging the S&P by a wide margin year to date.
The next quarterly filing will show whether the interchange MDL provisions keep landing, and whether Visa’s Value Added Services and stablecoin bridge revenue can outrun the erosion in its core. Until then, the $707 million line item is the one worth watching.
Contact [email protected] for any questions or corrections.













 Top Gaining Stocks
 Top Losing Stocks