SanDisk vs Seagate: Two Divergent Paths Through the AI Storage Boom, One Winner
SanDisk and Seagate both posted stunning quarters fueled by AI demand, but they are chasing completely different versions of the storage boom. Which approach holds up when the cycle turns?

This post may contain links from our sponsors and affiliates, and Flywheel Publishing may receive compensation for actions taken through them.

SanDisk (NASDAQ: SNDK | SNDK Price Prediction) and Seagate Technology (NASDAQ: STX) just delivered blockbuster March quarter results, and both credit the same force: AI data creation.
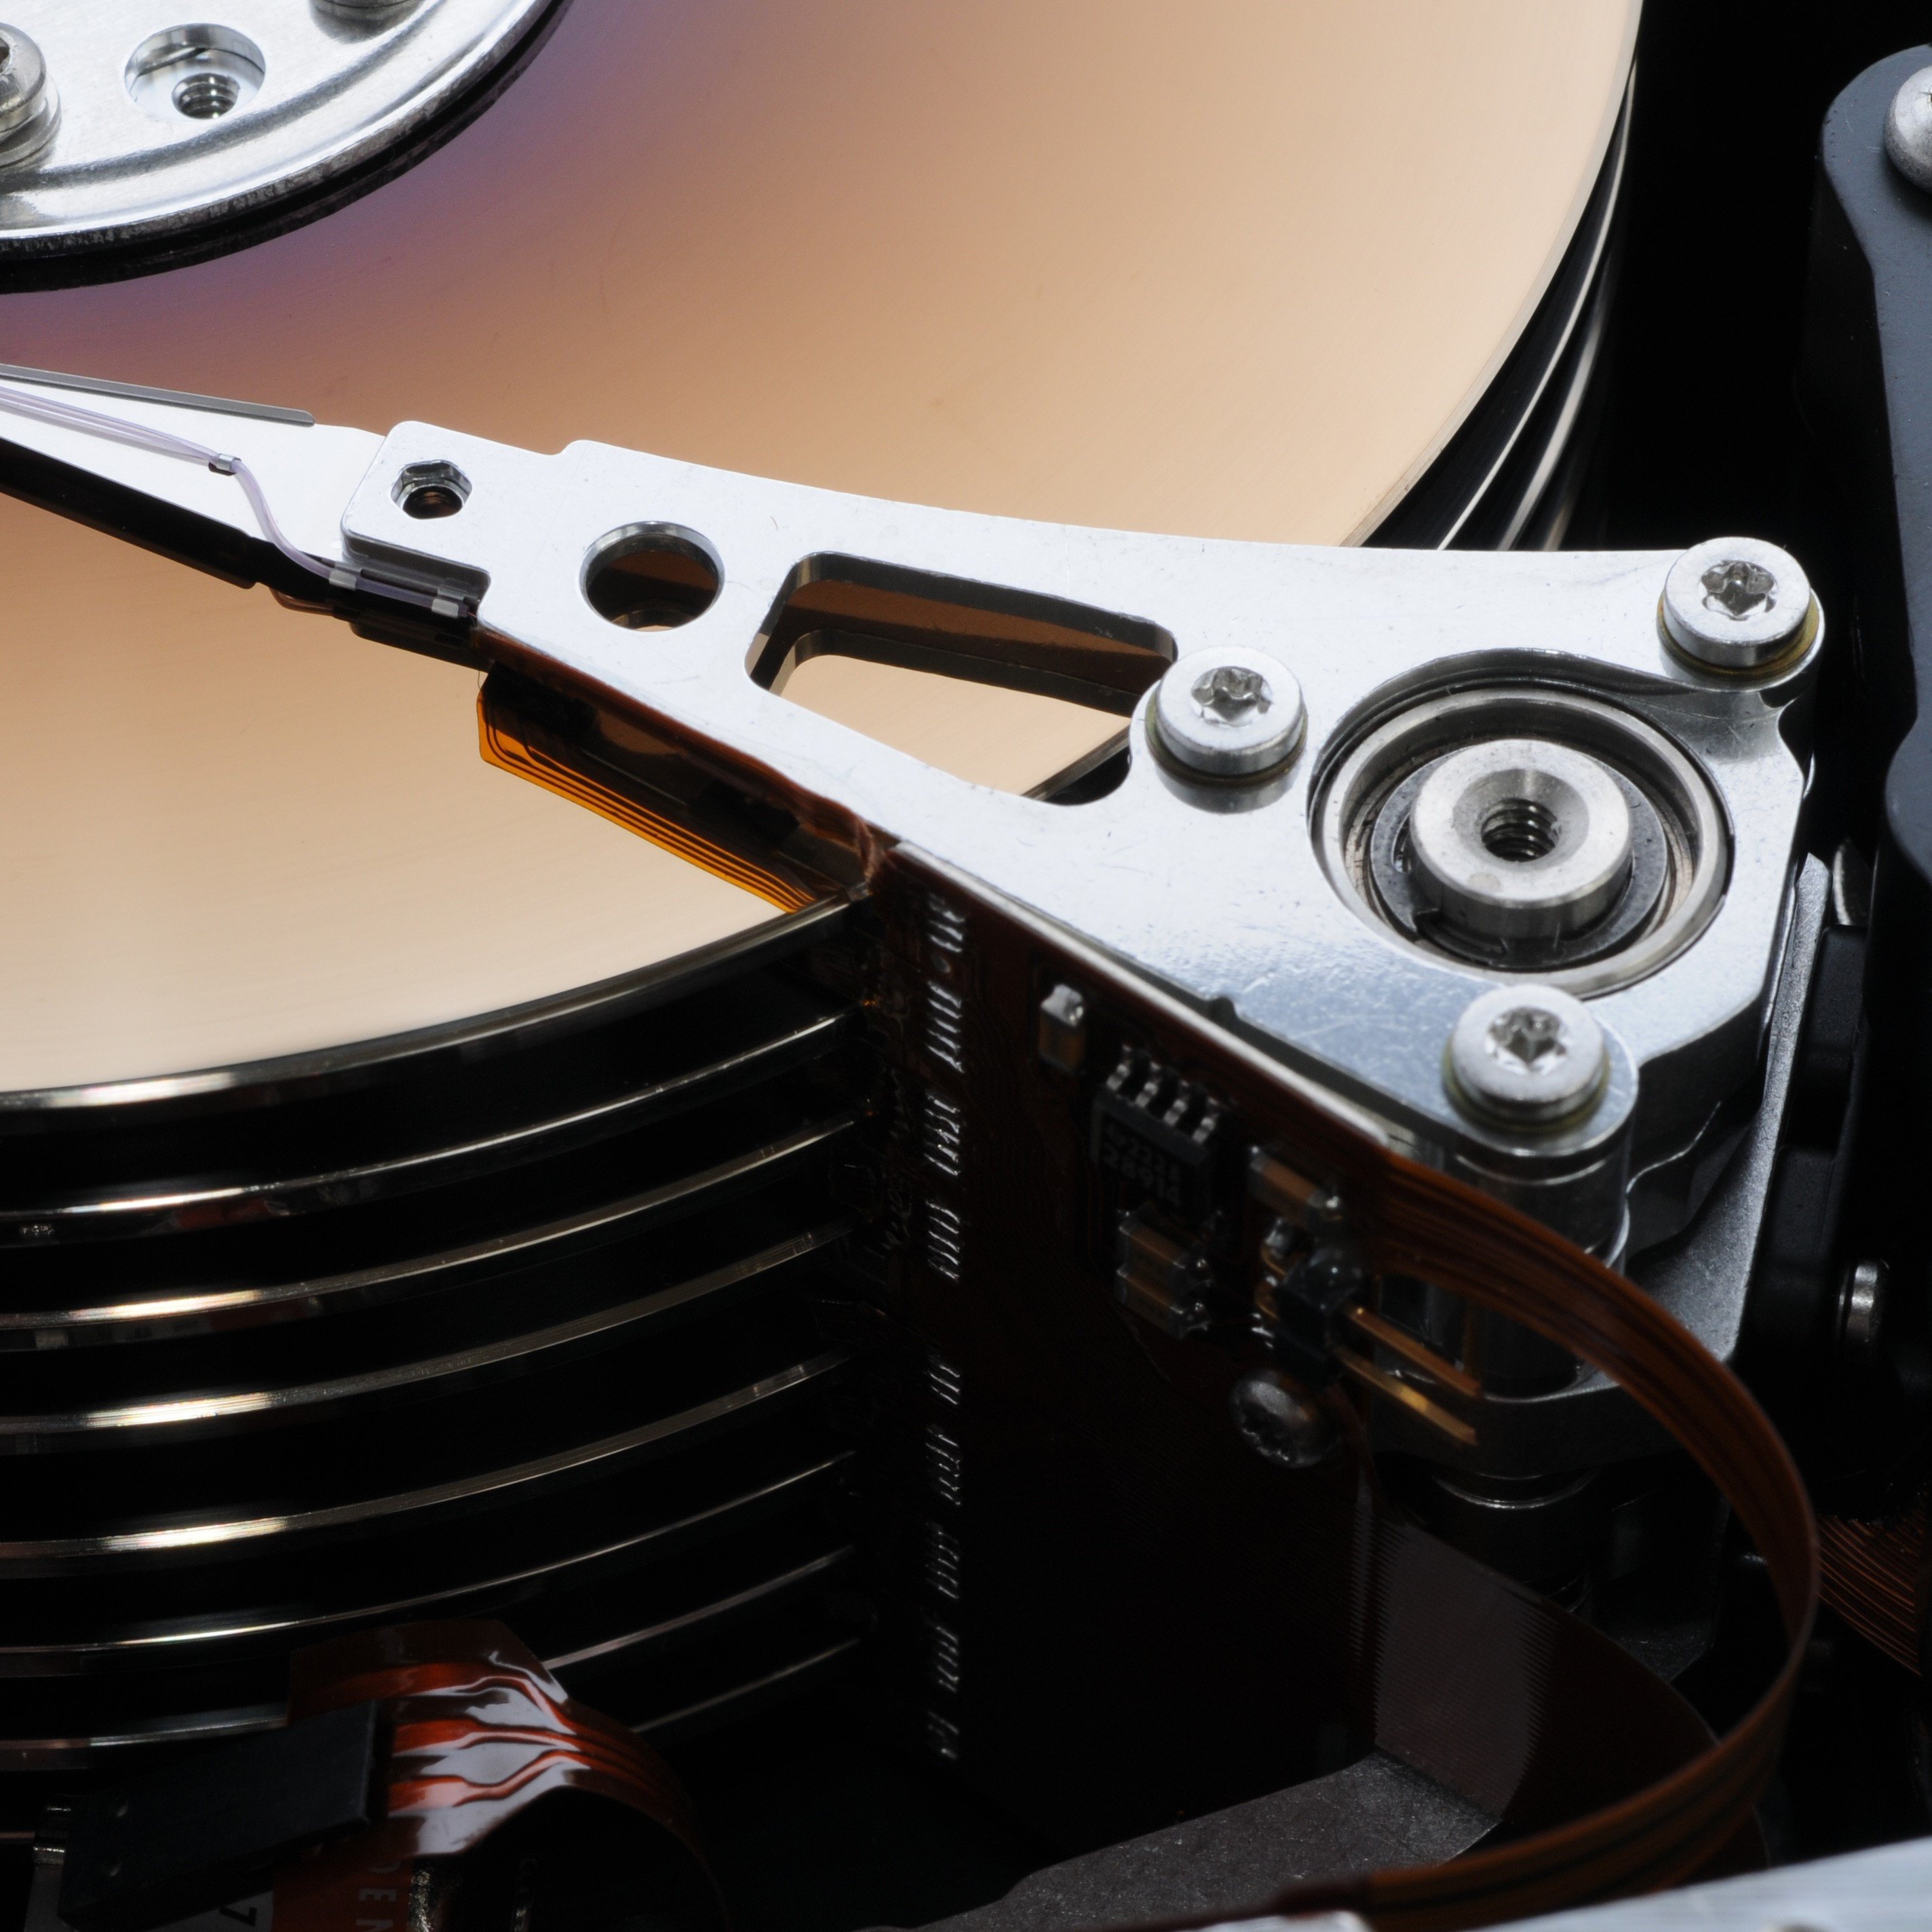
One sells NAND flash for high-speed inference. The other sells nearline HDDs that warehouse petabytes cheaply. Comparing them now shows how storage is splitting into two distinct AI supply chains.
Flash Explodes. Spinning Disks Grind Higher.
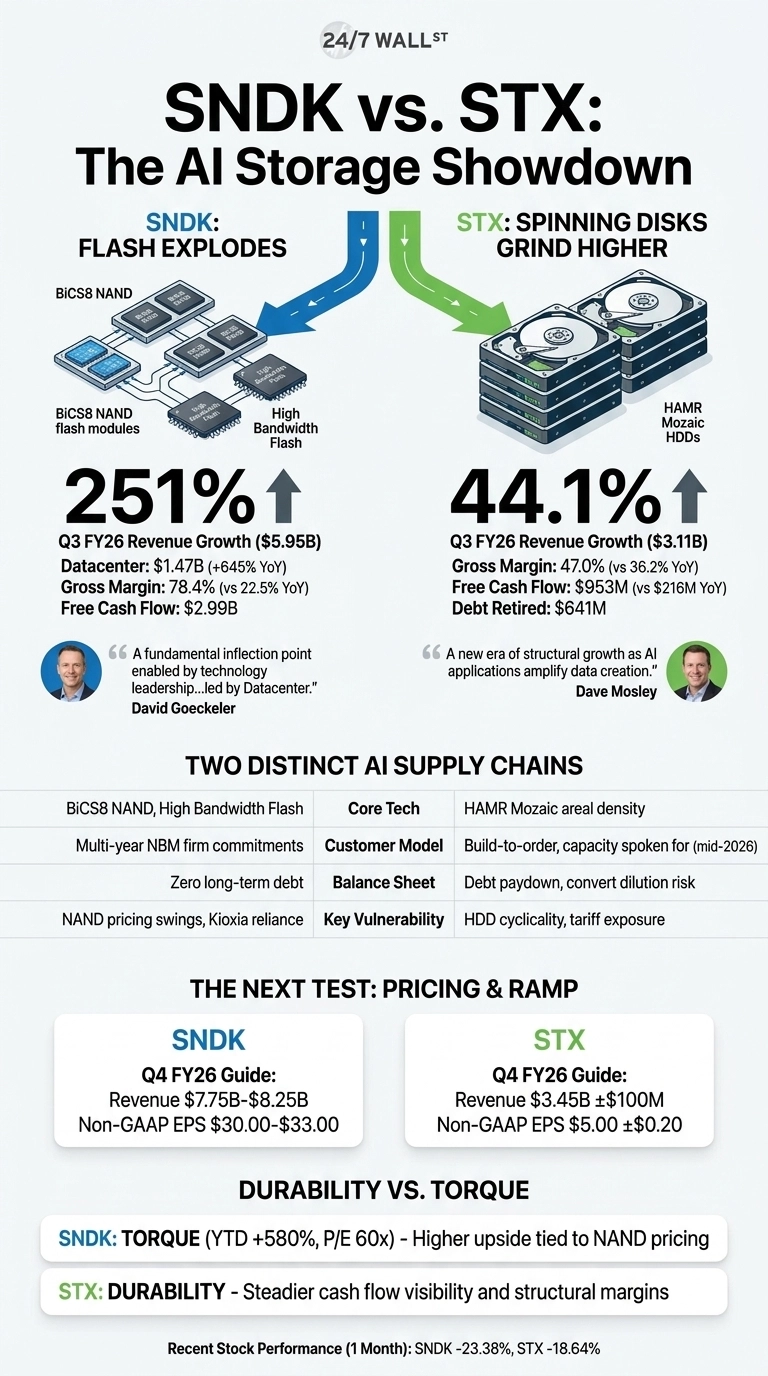
SanDisk posted $5.95 billion in revenue, a 251% jump, with Datacenter alone surging 645% year over year to $1.467 billion. Gross margin swung to 78.4% from 22.5% a year ago, a move that only makes sense when NAND pricing is genuinely scarce. CEO David Goeckeler called it “a fundamental inflection point” tied to BiCS8 flash and High Bandwidth Flash for AI inference.
Seagate’s numbers look calmer but no less structural. Revenue reached $3.11 billion, up 44.1%, with non-GAAP gross margin hitting 47%. Free cash flow leapt to $953 million from $216 million. Dave Mosley framed the quarter as “a new era of structural growth as AI applications amplify data creation.” The Mozaic HAMR platform is now qualified with five of the world’s largest cloud customers.

Two Very Different Bets on AI Storage
| Lens | SanDisk | Seagate |
| Core Tech | BiCS8 NAND, High Bandwidth Flash | HAMR Mozaic areal density |
| Customer Model | Multi-year NBM firm commitments | Build-to-order, capacity spoken for |
| Balance Sheet | Zero long-term debt | Debt paydown, convert dilution risk |
| Key Vulnerability | NAND pricing swings, Kioxia reliance | HDD cyclicality, tariff exposure |
SanDisk is locking hyperscalers into five New Business Model agreements with firm financial commitments, trying to convert a historically brutal commodity cycle into something that looks like a subscription.
Seagate is doing the opposite in spirit: leaning on decades of areal density expertise to be the cheapest place to park an exabyte. Mosley noted nearline capacity is committed through mid-calendar 2026, which is the sort of visibility HDD investors rarely get.
The Next Test Is Whether Pricing Holds
SanDisk guided Q4 revenue to $7.75 billion to $8.25 billion and EPS to $30 to $33, which prices in another leg of NAND tightness. I will watch consumer, which slipped 10% sequentially, and any hint that Kioxia supply dynamics shift.
Seagate’s guide of $3.45 billion revenue and $5 EPS depends on Mozaic ramping cleanly at 4-plus TB per disk. Both stocks have cooled recently, with SNDK down 23.38% over the past month and STX off 18.64%, so expectations are elevated.
Why I Lean Seagate for Durability, SanDisk for Torque
On the data, Seagate looks like the steadier expression of the AI storage story. The 47% gross margin and build-to-order visibility feel structural and durable.
SanDisk offers more upside if NAND stays tight, and the 580% YTD run shows the market agrees, but a 60x P/E leaves less margin for error. For investors focused on AI torque, SanDisk carries more upside tied to NAND pricing, while Seagate offers steadier cash flow visibility.
Contact [email protected] for any questions or corrections.
Vandita Jadeja is a financial publisher with over a decade of experience writing about financial topics, including investment, savings, retirement, insurance and banking. Vandita is a Chartered Accountant who loves to debunk financial concepts for readers.
Her work has appeared on sites that include The Motley Fool, InvestorPlace, and Benzinga. She covers investing and focuses on stock picks and price prediction for 24/7 Wall St.
When not looking for the next stock investment opportunity, she can be found traveling, reading, chasing sunsets and enjoying her iced latte.