Bank of America vs American Express: Only One Financial Stock Deserves Your Money
Bank of America and American Express both crushed Q2 earnings, but the market rewarded only one of them while punishing the other. The gap between their stories reveals something important about where financial stocks are actually headed.


Bank of America (NYSE:BAC | BAC Price Prediction) and American Express (NYSE:AXP) just posted Q2 2026 results that showcase two very different financial machines.
Bank of America rode a trading and investment banking surge to its strongest quarter in years. American Express leaned on premium cardholders spending at the fastest clip in three years. Both beat on earnings. Only one has been rewarded by the market.
Trading Desks Lift BAC. Platinum Cards Carry AXP.
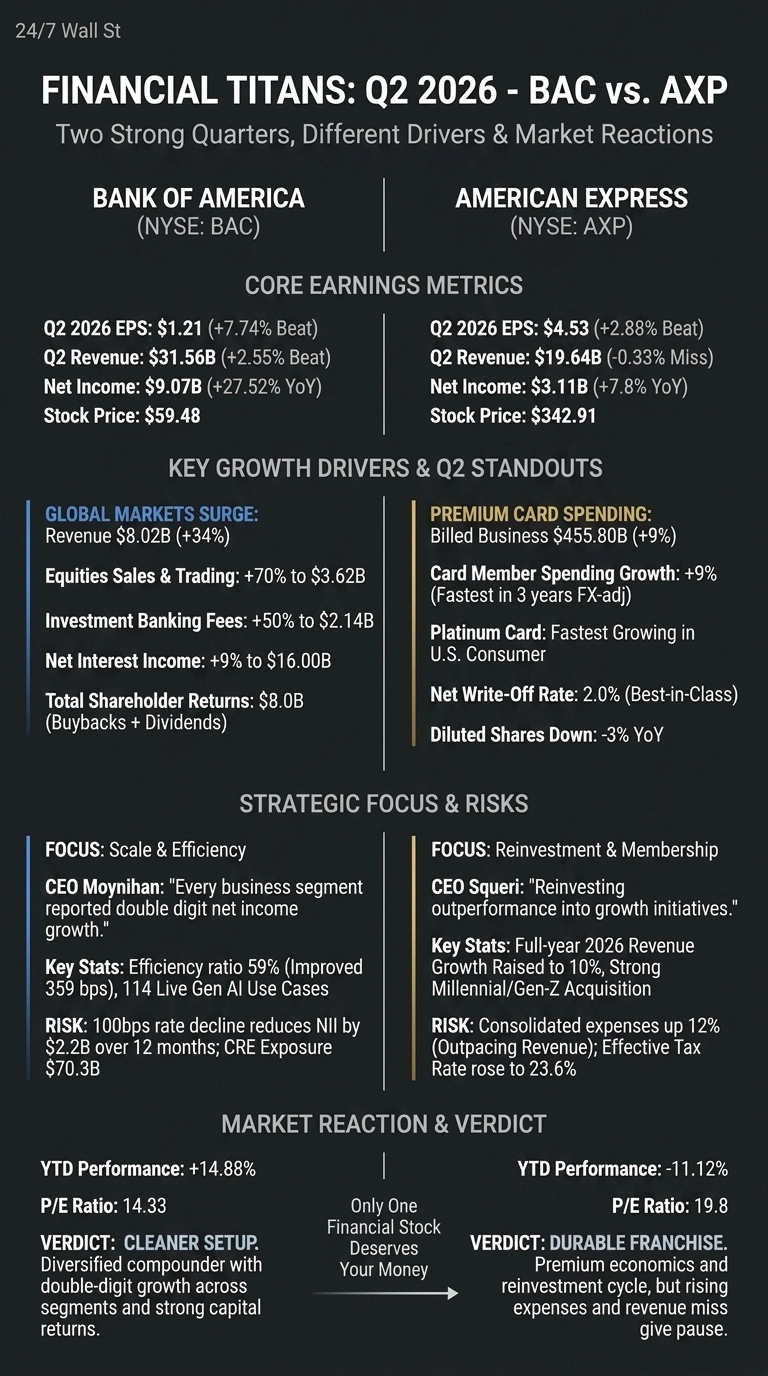
Bank of America’s quarter was a Wall Street story. Global Markets revenue jumped 34% to $8.02 billion, with equities sales and trading exploding 70% to $3.622 billion and investment banking fees climbing 50% to $2.138 billion.
Net interest income rose 9% to $16 billion, and combined credit and debit card spend reached $266 billion. CEO Brian Moynihan called it “one of our strongest quarters to date” with every segment posting double-digit net income growth.
American Express told a narrower, cleaner story. Billed business hit $455.80 billion, up 9%, the fastest FX-adjusted rate in three years. The refreshed Platinum Card became the fastest-growing portfolio in U.S. Consumer.
Net write-offs held at 2%, best-in-class for the industry. Revenue of $19.637 billion narrowly missed the $19.703 billion consensus, a small blemish on an otherwise clean scorecard.
Diversified Universal Bank vs. Premium Closed Loop
| Lens | BAC | AXP |
| Core Engine | NII plus markets and IB fees | Card fees and discount revenue |
| Q2 Standout | Equities trading up 70% | Platinum-led spend up 9% |
| Capital Return | $8.0B buybacks and dividends | Diluted shares down 3% |
| Key Vulnerability | NII drops $2.2B on 100bps cut | Expenses up 12% vs. 10% revenue |
Moynihan runs a scale game across 70 million clients, using digital tools like Erica and 114 live generative AI use cases to lift efficiency. The efficiency ratio improved 359 basis points to 59%.
Stephen Squeri, meanwhile, is layering on new spend catalysts, including the proposed TheFork acquisition covering 50,000 restaurants across 11 countries and an ALL Accor loyalty tie-up. His investment thesis leans on Millennial and Gen-Z acquisition, which he describes as “greater lifetime value.”
The Next Test Is Rates and Reinvestment
I will be watching whether BAC can protect NII if the Fed cuts. Trading revenue is cyclical, and a $70.3 billion commercial real estate book still deserves scrutiny.
For AXP, Squeri is reinvesting outperformance rather than dropping it to the bottom line. That kept full-year EPS guidance at $17.30 to $17.90 even after raising revenue growth to 10%. Investors clearly want more flow-through.
AXP fell 8.21% in the week around the earnings report and sits down 11.12% year to date, while BAC is up 14.88%.
Why I Lean Toward Bank of America Right Now
If you want the stock to confirm the thesis, BAC is winning that argument today. I like the breadth: consumer, wealth, banking, and markets all posted double-digit gains, and management is returning $8 billion quarterly to shareholders at a P/E of 14.
Amex is the higher-quality franchise in my view, with a P/E of 20 and durable premium economics, but rising expenses and a slight revenue miss give me pause. For investors focused on Squeri’s reinvestment cycle, AXP’s current discount is worth monitoring. For me, the diversified compounder trading at a mid-teens multiple is the cleaner setup this quarter.
Contact [email protected] for any questions or corrections.
Vandita Jadeja is a financial publisher with over a decade of experience writing about financial topics, including investment, savings, retirement, insurance and banking. Vandita is a Chartered Accountant who loves to debunk financial concepts for readers.
Her work has appeared on sites that include The Motley Fool, InvestorPlace, and Benzinga. She covers investing and focuses on stock picks and price prediction for 24/7 Wall St.
When not looking for the next stock investment opportunity, she can be found traveling, reading, chasing sunsets and enjoying her iced latte.