Meta vs. Alphabet: Which Stock Deserves a Spot in Your Portfolio After Q2?
Meta and Alphabet both poured record billions into AI last quarter, but one came out with expanding margins and a soaring cloud business while the other watched free cash flow crater 91%. The gap between their results raises a hard…

This post may contain links from our sponsors and affiliates, and Flywheel Publishing may receive compensation for actions taken through them.
Meta (NASDAQ: META | META Price Prediction) and Alphabet (NASDAQ: GOOG) both delivered Q2 2026 results that reshaped how investors think about big tech’s AI spending race.
Meta beat on revenue but missed EPS by 14.42%, snapping a six-quarter beat streak. Alphabet blew past estimates on both lines, powered by a Google Cloud surge. Both companies are pouring tens of billions into AI, and the market is asking which strategy actually pays.
Ad Engine Roars, Margins Buckle at Meta
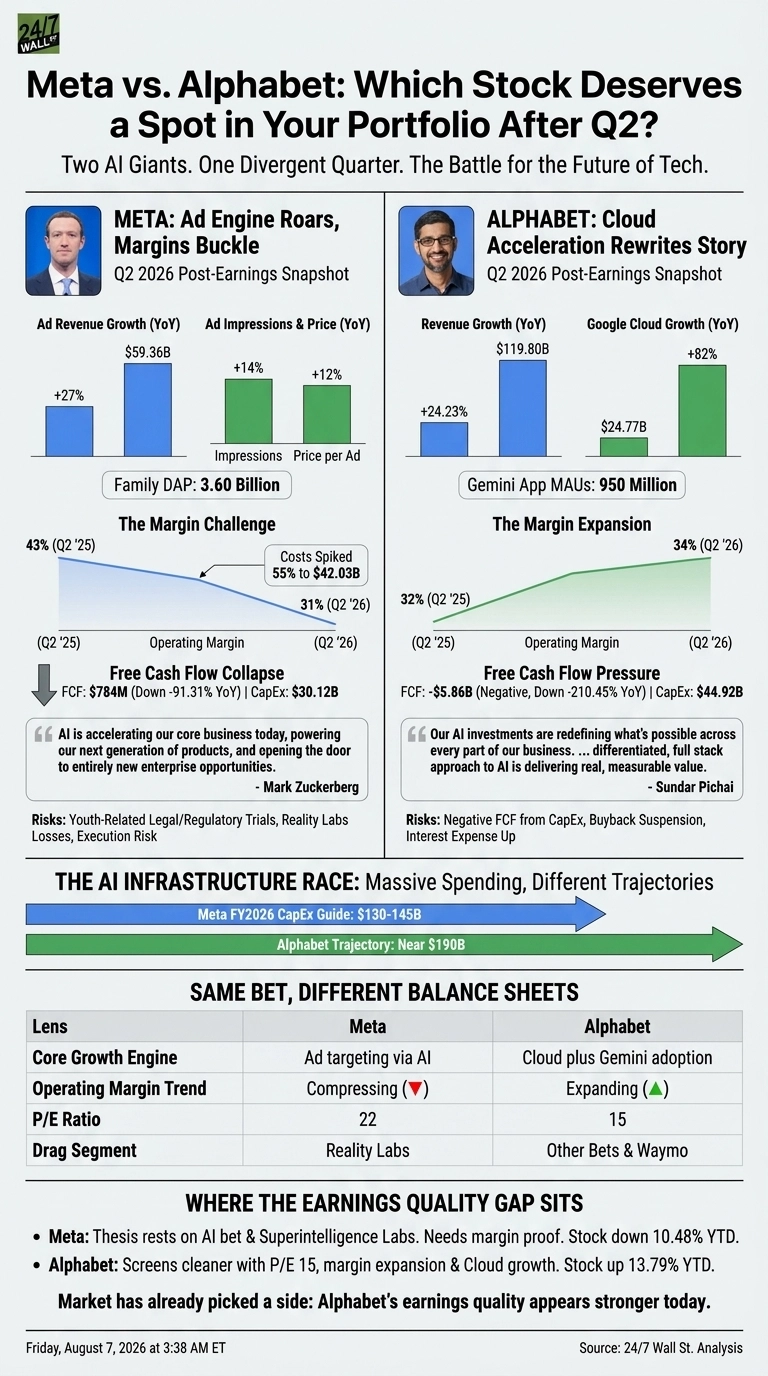
Meta’s advertising business is humming. Ad revenue climbed 27% year over year to $59.36 billion, with impressions up 14% and price per ad up 12%. Family DAP reached 3.60 billion, showing engagement across Facebook, Instagram, and WhatsApp remains sticky.
The trouble sits below the top line. Operating margin compressed to 31% from 43% as costs jumped 55% to $42.03 billion. A $2.40 billion legal charge tied to youth litigation and $1.18 billion in severance from an 8,000 headcount reduction did the damage.
Free cash flow collapsed to $784 million, down 91.31%, as CapEx climbed to $30.12 billion. Mark Zuckerberg framed it as necessary pain: “AI is accelerating our core business today, powering our next generation of products, and opening the door to entirely new enterprise opportunities.” Investors need to trust that promise.

Cloud Acceleration Rewrites Alphabet’s Story
Alphabet’s quarter was cleaner. Revenue rose 24.23% to $119.80 billion, with Google Cloud accelerating to 82% growth at $24.77 billion. Search added 17%, YouTube ads 13%, and subscriptions 15%. Operating margin expanded to 34%, opposite to Meta.
Gemini is now a mass product. It processes 22 billion API tokens per minute, the Gemini App reached 950 million monthly active users, and nearly 90% of the Fortune 100 use Gemini Enterprise.
Sundar Pichai called it “an amazing quarter“. The catch: Alphabet spent $44.92 billion on CapEx, ran free cash flow negative at -$5.86 billion, and suspended its buyback. That is substantial trust the market is extending.
Same Bet, Different Balance Sheets
| Lens | Meta | Alphabet |
| Core Growth Engine | Ad targeting via AI | Cloud plus Gemini adoption |
| 2026 CapEx Guide | $130-145B | Trajectory near $190B |
| Operating Margin Trend | Compressing | Expanding |
| P/E | 22 | 15 |
| Drag Segment | Reality Labs | Other Bets and Waymo |
Meta is betting the ad engine plus Superintelligence Labs will convert massive spend into a new enterprise franchise. Alphabet already has paying cloud customers absorbing its GPUs.
Retail sentiment reflects the gap: Meta’s Reddit chatter recovered to a bullish 78 score by August 7 after cratering to 33 on earnings day, while GOOG’s composite sits at neutral-to-positive.
The Next Test Is CapEx Payback
I will watch whether Meta’s Q3 revenue guide of $61-64 billion holds and whether ad pricing keeps pace with impressions.
For Alphabet, the question is whether Cloud can sustain triple-digit-adjacent growth long enough to justify the buyback pause. Meta shares are down 10.48% year to date; Alphabet is up 13.79%. The market has already picked a side.
Where the Earnings Quality Gap Sits
On the numbers, Alphabet screens more cleanly today. A 15 P/E for a business expanding margins while Cloud grows 82% is a tighter risk profile than Meta’s current setup.
Meta’s thesis rests on Zuckerberg’s AI bet and the option value on Superintelligence Labs, which requires more quarters of margin evidence to validate. If youth litigation charges stabilize and CapEx begins producing measurable ad-yield gains, the picture shifts. For now, Alphabet’s earnings quality is the stronger data point.
Contact [email protected] for any questions or corrections.
Vandita Jadeja is a financial publisher with over a decade of experience writing about financial topics, including investment, savings, retirement, insurance and banking. Vandita is a Chartered Accountant who loves to debunk financial concepts for readers.
Her work has appeared on sites that include The Motley Fool, InvestorPlace, and Benzinga. She covers investing and focuses on stock picks and price prediction for 24/7 Wall St.
When not looking for the next stock investment opportunity, she can be found traveling, reading, chasing sunsets and enjoying her iced latte.