




My 24/7 Wall St. price target for Costco (NASDAQ:COST | COST Price Prediction) lands at $1,022.62, a modest step up from today’s $952.75. The model rates COST a buy with 90% confidence, but upside is narrow. Costco executes at an elite level, and the market already knows it.
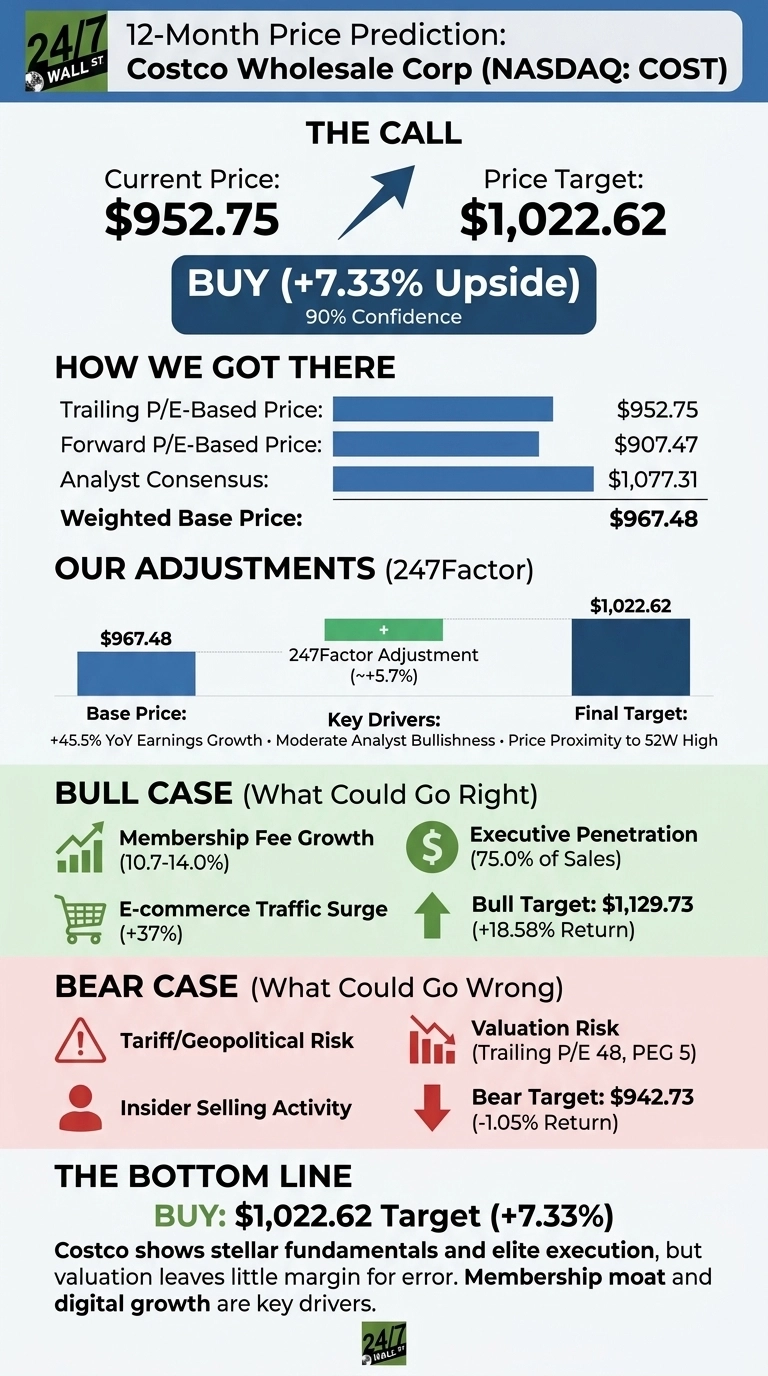
24/7 Wall St. Price Target Summary
| Metric | Value |
|---|---|
| Current Price | $952.75 |
| 24/7 Wall St. Price Target | $1,022.62 |
| Upside | 7.33% |
| Recommendation | BUY |
| Confidence Level | 90% |
A Flat Year Hiding a Strong Business
Costco shows stellar fundamentals meeting stalled price action. The stock is up 10.97% year to date but down 2.31% over the last year, trading about 2% below its 52-week high of $1,094.76 and well off the $840.35 low.
Fiscal Q3 2026, reported May 28, 2026, delivered EPS of $4.93 on revenue of $70.527 billion, up 11.58% year over year, with net income rising 15.19%. Comparable sales grew 9.8%, digital comps jumped 21.5%, and the worldwide membership renewal rate held at 89.7%.

The Case for $1,129 and Higher
Bulls have real ammunition. Our bull scenario points to $1,129.73, or an 18.58% total return. Membership fee income compounds at a 10.7% to 14.0% pace, executive membership penetration has climbed to 75% of sales, and e-commerce traffic surged 37% last quarter.
Warehouse count targets 940 by fiscal year-end. The Street’s consensus target of $1,077.31, backed by 4 Strong Buy and 19 Buy ratings, reflects that conviction.

What Could Go Wrong
The bear case takes COST to $942.73, a 1.05% loss. At a trailing P/E of 48 and a PEG of 5, valuation leaves no margin for a soft quarter. Tariff pressure, FX volatility, and rising wages remain live risks flagged in the 10-Q. Insider activity has skewed to selling.
Heavy capex on warehouses and distribution suppresses near-term free cash flow, though Costco’s 29.1% return on equity argues reinvestment earns its keep.
How Costco Compares to Walmart and BJ’s
Walmart (NYSE:WMT) is the direct scale comp. WMT trades at a P/E of 41 with a market cap of $896.56 billion, growing revenue at 6.1% in Q1 FY2027. Costco trades at a P/E of 48 while growing revenue nearly twice as fast, supporting the premium.
BJ’s Wholesale Club (NYSE:BJ) is the closest membership-model peer. BJ posted 9.86% revenue growth in Q1 FY2027 with a 90% tenured member renewal rate, on a market cap of $12.28 billion. The membership economics validate Costco’s model, but BJ’s smaller footprint underscores why COST commands scarcity value.
| Company | P/E Ratio | Market Cap |
|---|---|---|
| Costco | 48 | $420.3B |
| Walmart | 41 | $896.6B |
| BJ’s | N/A | $12.3B |
Quality Compounder at a Full Price
The 24/7 Wall St. price target of $1,022.62 is a buy with 90% confidence, but 7.33% upside is modest. Membership fee income and renewal rates form retail’s closest subscription moat.
The 200-day moving average sits near $958.09, a level worth watching. Key signals to monitor include comp sales growth holding above 5% and continued margin expansion.
Extending the model assumes current comp-sales momentum and membership economics persist.
| Year | 24/7 Wall St. Price Target |
|---|---|
| 2026 | $1,022 |
| 2027 | $1,085 |
| 2028 | $1,150 |
| 2029 | $1,215 |
| 2030 | $1,279 |
These assume roughly 30 warehouses annually and renewal rates near 90%. Digital penetration gains offer upside, while tariff shocks or membership fatigue could compress multiples toward the bear-case $1,066.95 five-year outcome.
Contact [email protected] for any questions or corrections.















 Top Gaining Stocks
 Top Losing Stocks