





Amazon (NASDAQ:AMZN | AMZN Price Prediction) briefly crossed the $3 trillion market cap threshold in early August. The question is whether the stock has more room to run or whether the milestone marked a near-term ceiling. There is still meaningful upside from here, and the 24/7 Wall St. price target reflects that.
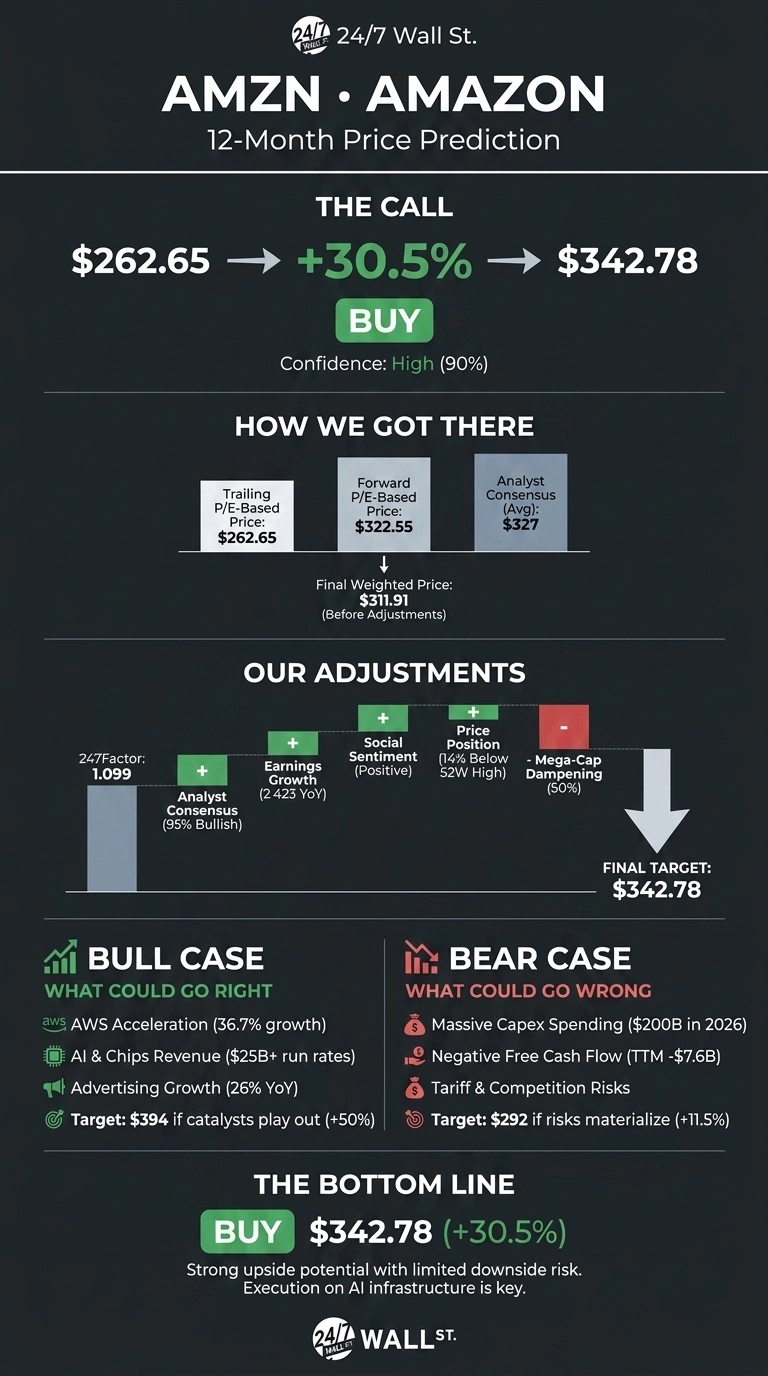
The 24/7 Wall St. price target for Amazon is $342.78 over the next 12 months, implying 30.51% upside from the current $262.65. Our recommendation is buy, with a 90% confidence level.
24/7 Wall St. Price Target Summary
| Metric | Value |
|---|---|
| Current Price | $262.65 |
| 24/7 Wall St. Price Target | $342.78 |
| Upside | 30.51% |
| Recommendation | BUY |
| Confidence Level | 90% |
From $3 Trillion Milestone to a Retreat
Amazon is up 13.79% year to date and 13.71% over the past year, but shares pulled back 4.31% after briefly clearing the $3 trillion mark on August 3. The stock sits 14% below its 52-week high of $287.20, and news that Jeff Bezos sold roughly $4 billion in shares around the milestone added to short-term pressure.
Fundamentals are accelerating. Q2 FY26 revenue reached $200.61 billion, up 19.62% year over year. AWS grew 36.7%, the fastest pace in 18 quarters, on a $169 billion annualized run rate and a $496 billion backlog. CEO Andy Jassy said AWS could ultimately be a “trillion dollar annual revenue business” over time.

The Case for $394 and Beyond

Our bull case points to $394.04, a 50% one-year return. AI and custom chips each cleared $25 billion annualized run rates with triple-digit growth, and Jassy noted that “the lion’s share of capacity in 27… is largely reserved”.
Anthropic and OpenAI have multi-gigawatt Trainium commitments. Advertising grew 26% to $19.81 billion. Analyst consensus target sits at $327, with 16 Strong Buy, 43 Buy, 3 Hold, and 0 Sell ratings.

What Could Go Wrong
The bear case lands near $292.87, still 11.5% above today. Core risk is spending. Q2 capex was $54.21 billion, up 68.44%, and full-year 2026 capex is guided to roughly $200 billion, pressuring free cash flow, which is TTM negative at -$7.6 billion.
Bulls counter that Jassy framed this as a timing mismatch, with data centers built two years before monetization and server contracts locked in for five years or more. Tariff exposure, FX headwinds of roughly 80 basis points, and competition from Azure and Google Cloud remain live risks.
How Amazon Compares to Microsoft and Alphabet
Microsoft (NASDAQ:MSFT) trades at a P/E of 28 with an operating margin of 46.8%, versus Amazon’s 11.16%. Microsoft’s Azure grew 43% last quarter, edging AWS on growth, and its $678 billion backlog is larger than Amazon’s. That premium multiple makes AMZN look reasonably priced on our target.
Alphabet (NASDAQ:GOOGL) posted 82% Google Cloud growth to $24.77 billion in Q2, the fastest hyperscaler expansion. Its $4.23 trillion market cap exceeds Amazon’s despite a smaller retail base, suggesting the market pays up for accelerating cloud AI. That supports the 24/7 Wall St. price target of $342.78 as a fair valuation.
Amazon Price Prediction 2026-2030
The 24/7 Wall St. price target of $342.78 and buy rating carry 90% confidence. The AWS re-acceleration paired with a reserved 2027 capacity book tips the scale.
The bullish case strengthens if AWS holds above 30% growth into Q3. The thesis weakens if free cash flow deteriorates further without visible monetization of the 2026 capex wave. On today’s setup, the risk-reward skews favorably for shareholders.
| Year | 24/7 Wall St. Price Target |
|---|---|
| 2026 | $292 |
| 2027 | $343 |
| 2028 | $400 |
| 2029 | $470 |
| 2030 | $540 |
These projections assume Amazon continues executing on AWS, AI infrastructure, and advertising. Upside could come from Zoox commercialization or Amazon Leo revenue ramping; downside would stem from AI capex overshoot or a cloud demand pause.
Contact [email protected] for any questions or corrections.











 Top Gaining Stocks
 Top Losing Stocks