In a Head-to-Head Matchup, Jamie Dimon Is Bested by the Bank CEO Pretty Much No One Has Ever Heard of
Jamie Dimon runs the most powerful bank on the planet, so comparing any rival CEO to him sounds absurd. But strip away one headline number and the operator who built a quieter empire starts looking like the sharper executive.

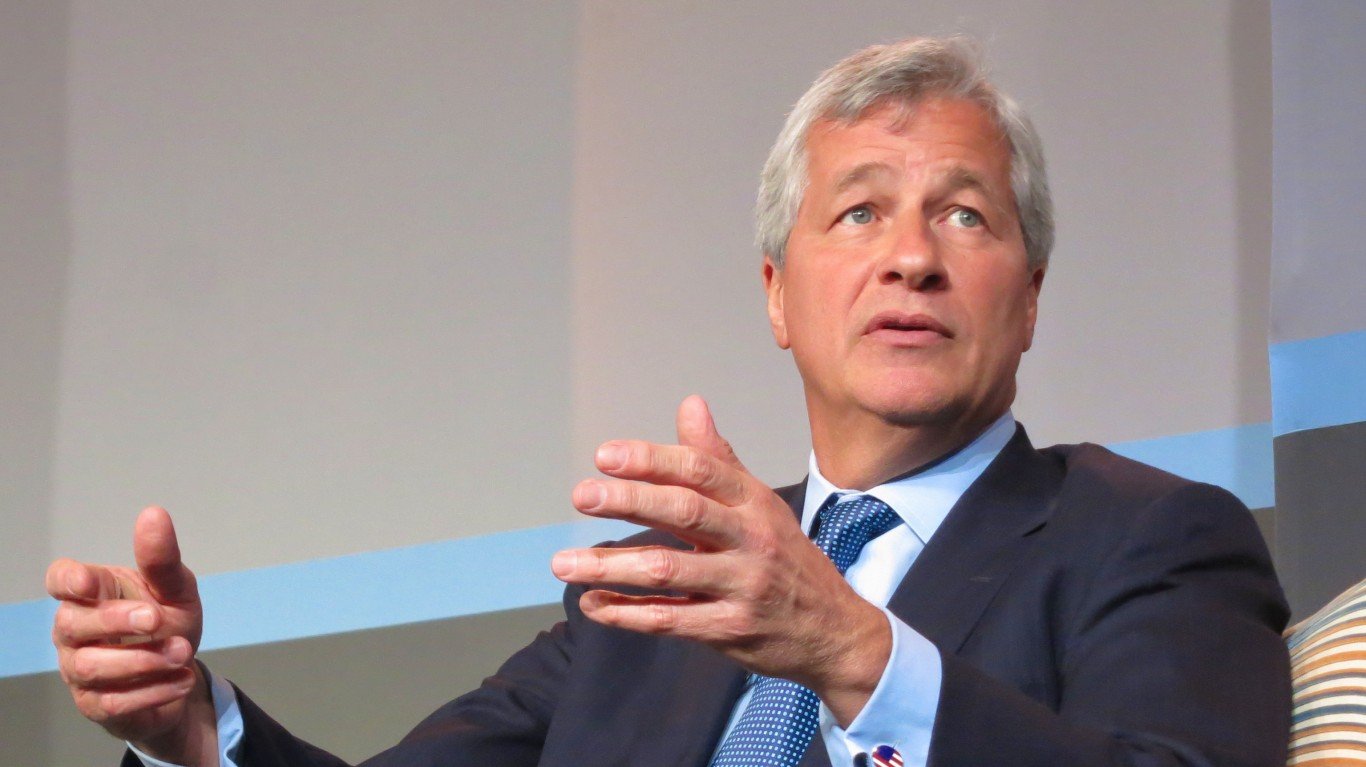
Jamie Dimon is one of those big-name CEOs who you seem to read about everywhere. He’s a gifted operator who has had an incredible run as CEO at JPMorgan Chase (NYSE:JPM | JPM Price Prediction).
And yet – when you look at the operational metrics that actually matter (aside from just price returns) and that a bank CEO has actual control over, Ted Pick at Morgan Stanley (NYSE:MS) edges him out. Here’s how:
What a CEO Can Impact
At its core, a bank CEO’s job is to allocate resources to the most profitable outcomes – generating a higher net profit margin, boosting return on assets (ROA), and using leverage appropriately to boost return on equity (ROE) while balancing against credit risk.
| Metric (TTM, period end 6/30/26) | JPMorgan (Dimon) | Morgan Stanley (Pick) |
|---|---|---|
| Return on equity | 17.8% | 18.0% |
| Return on assets | 1.4% | 1.4% |
| Net profit margin | 34.9% | 25.9% |
| Price/book | 2.7 | 3.2 |
| P/E | 16 | 18 |


Pick (narrowly) wins return on equity; Dimon wins return on assets (very narrowly) and net profit margin (by quite a bit). So you’d think, “case closed,” it’s Dimon by a hair because of the big net profit margin, right?
Well, it turns out that the story is a little more complicated than that…
Digging Deeper
Dimon’s figures are flattered by a huge one-time item: Q2 FY26 included a $4.6B net gain tied to a Visa Class C share exchange offer plus $1.0B in equity investment gains – accounting for a total of $1.54 out of the reported quarterly EPS of $7.70. That gain inflates both ROE and ROA.
That’s not to say that Morgan Stanley’s earnings were devoid of gains that also boosted ROE and ROA – there were plenty of things on their end too, just nothing anywhere close to what JP Morgan reported.
The Case for Dimon
The case for Dimon can be boiled down to two words: Scale matters.
Q2 FY26 produced revenue of $57.3B with net income of $21.2B, up 41.2%. Commercial and Investment Bank revenue rose 27% to $24.9B, with Equity Markets up 86% to $6.0B and investment banking fees up 30% to $3.3B, the highest since 2021. Assets under management reached $5.1 trillion.
JPMorgan ranks number one in US retail deposits for five consecutive years and number one in global investment banking fees with 9.8% wallet share, across 5,135 branches and 63.7 million active mobile customers, backed by a $50.0B share repurchase program. Dimon’s company-disclosed profitability: “an ROTCE of 23%, excluding gains related to Visa and certain equity investments”.

The Case for Pick
Morgan Stanley’s most recent quarter marked a step-change.
Q2 FY26 delivered record revenues of over $21.0B and record EPS of $3.5, with net income of $5.6B, up 57.7%. Equity trading revenue rose 69% to $6.3B, with Asia up 71% to $3.9B. Investment banking rose 58% to $2.4B. Wealth Management added a record $148.0B in net new assets, and total client assets across Wealth and Investment Management reached the $10 trillion milestone. Alternatives and Solutions AUM grew to $852.0B, up 22%.
The expense efficiency ratio improved to 65% in Q1 FY26 from 68% a year earlier. Company-disclosed ROTCE was 26.6% in Q2 FY26, up from 18.2% a year earlier, and 27.1% in Q1 FY26. So as you can see, Morgan Stanley is growing a lot faster…off, admittedly, a much smaller base than JP Morgan.

How Pick (Narrowly) Wins
Pick leads on return on equity and company-disclosed ROTCE. The gap widens when stripping out the Visa gain from JP Morgan’s ROE. The same logic applies to Dimon’s ROA edge, which swings to Pick when you strip out those one-time items. Dimon holds net profit margin more clearly, though it is the least comparable metric when comparing a universal bank like Morgan Stanley vs an investment bank like JP Morgan.
Which means, surprisingly enough to me at least, that by these measures, Pick is clearly the better CEO. He doesn’t have the name or the fame or the size of platform that Dimon does, but when it comes down to the actual core work of being a CEO, he’s getting Morgan Stanley to achieve more.
Of course, this is all by a pretty narrow margin, so stay tuned for earnings and let’s see whether Pick can keep this real – but narrow – edge.
Contact [email protected] for any questions or corrections.
I've spent more than 15 years inside enterprise software, working alongside the finance, sales operations, and HR leaders who run the revenue engines at some of the largest tech companies in the country.
My day job is helping enterprise executives make smarter decisions about retention, compensation, and growth. These are the same operational levers that show up in every earnings report investors actually read. That perspective shapes my writing for 24/7 Wall St.
The headline numbers are easy. The interesting stuff is underneath: how companies make money, what executives are worried about, and what any of it means for the person checking their 401(k) on a Sunday afternoon. I write about personal finance and business as someone who has spent her career inside the rooms where these decisions get made.