Tim Cook vs Satya Nadella: One Has Better “Vibes”, the Other Is the Better CEO
Tim Cook and Satya Nadella both run trillion-dollar empires with impressive numbers, but strip away the accounting noise and buyback tricks and only one of them is actually winning where it counts.

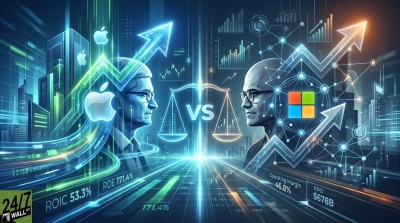
Tim Cook and Satya Nadella are two of the most-watched CEOs in the world, running two of the largest and most important companies in the world (Apple (NASDAQ:AAPL | AAPL Price Prediction) and Microsoft (NASDAQ:MSFT)).
And while plenty of people judge CEOs based on “the vibes” – which, Nadella all the way – I prefer to look at the actual operational metrics they can impact.
Let’s dive in.
What counts
| Metric | Cook / Apple | Nadella / Microsoft |
|---|---|---|
| Return on invested capital | 53.3% | 22.0% |
| Return on equity | 171.4% | 34.0% |
| Return on assets | 30.9% | 19.4% |
| Operating margin | 32.0% | 46.8% |
| Debt / equity | 1.5x | 0.3x |
At its core, the CEO’s job is to take capital, invest it profitably, and generate a return for shareholders. Return on invested capital (ROIC) and return on assets (ROA) measure this effectively, while return on equity (ROE) helps us see whether the CEO is smartly deploying leverage. Of course, debt/equity shows how much risk they’re incurring to generate that return. And of course, there’s good old operating margin to show how profitable the underlying business is. As you can see, Cook and Apple win big on ROIC, ROE, and ROA, while Nadella and Microsoft win on operating margin.
The most eye-catching number in the table is Cook’s return on equity. It is also the one to trust the least at face value. Years of buybacks have shrunk Apple’s equity base to a sliver relative to earnings, which mechanically pushes ROE upward. Apple repurchased $62.1B of stock in the nine months through June 27, 2026, $90.7B across fiscal 2025, and the board authorized another $100B program. The buyback effect inflates the size of Cook’s ROE lead. Nadella’s operating margin edge, meanwhile, has nothing to do with capital structure at all.
There is, of course, some more nuance to consider:
Apple’s Q3 FY26 gross margin picked up roughly 2 percentage points from tariff refunds, and shareholders’ equity rose 63.3% year over year to $107.5B, so the equity base is rebuilding from the trough. Microsoft’s recent net income is noisy for different reasons: Q4 FY26 included a $3.2B gain from its Anthropic investment, while Q2 FY26 included $7.6B in net gains from OpenAI investments. Investment mark-ups are not operating performance! (But they do tell us something about Nadella’s allocation philosophy.)
The Case For Cook
Cook is running a mature consumer hardware franchise with a services flywheel bolted on, and by the returns numbers he is running it very well. Q3 FY26 revenue grew 16.4% to $109.4B with net income up 27.1% to $29.8B; iPhone contributed $54.3B and Services $30.7B. Fiscal 2025 revenue was $416.2B, up 6.4%, with net income of $112.0B, up 19.5%. The installed base has passed 2.5 billion active devices. Cook’s ROIC is the highest in the Magnificent 7. Unlike ROE, there’s no leverage on that number.

The Case For Nadella
Nadella is running the largest infrastructure buildout in Microsoft’s history, and the operating line holds up anyway. Azure grew 43% in Q4 and crossed $100.0B in full-year revenue. Microsoft Cloud reached $59.3B, up 27%. Commercial remaining performance obligation climbed 84% to $678.0B. Microsoft 365 Copilot passed 30 million paid seats. Full-year revenue was $331.8B, up 17.8%, with net income of $133.7B, up 31.3%. He does it with roughly a fifth of Apple’s leverage. An operating margin of 46.8% versus 32.0% is what a well-run software-heavy mix actually looks like at the operating line.

Verdict
By these measures on this date, Cook leads on three of four, including the leverage-adjusted one that matters most (ROIC), and I’ll call that the win. Cook’s 171.4% return on equity should not be read at face value, and Nadella’s operating margin advantage is cleaner than any single number in Cook’s column. It is a narrower call than the table looks. If Microsoft’s $678B backlog converts to revenue at anywhere near current cloud margins, this comparison will likely look different a year from now.
Contact [email protected] for any questions or corrections.
I've spent more than 15 years inside enterprise software, working alongside the finance, sales operations, and HR leaders who run the revenue engines at some of the largest tech companies in the country.
My day job is helping enterprise executives make smarter decisions about retention, compensation, and growth. These are the same operational levers that show up in every earnings report investors actually read. That perspective shapes my writing for 24/7 Wall St.
The headline numbers are easy. The interesting stuff is underneath: how companies make money, what executives are worried about, and what any of it means for the person checking their 401(k) on a Sunday afternoon. I write about personal finance and business as someone who has spent her career inside the rooms where these decisions get made.