1 Chart Shows Why You Should Buy Stocks, Not Bonds
A rarely seen gap has opened between stocks and bonds, and the data behind it carries both a compelling opportunity and a warning that most investors will overlook.


The investing landscape has changed dramatically over the past decade. Inflation has returned, interest rates have moved sharply higher, and the traditional assumption that bonds will reliably cushion a stock portfolio has been tested. Yet one asset class has emerged as the clear winner.
U.S. stocks have delivered a decade of returns that leave Treasuries looking like the understudy who never got called onto the stage. According to Topdown Charts, the gap between the two has reached a level rarely seen in financial-market history — offering investors an important lesson about where returns have come from and where they might continue to come from.
Stocks Have Left Bonds In The Dust
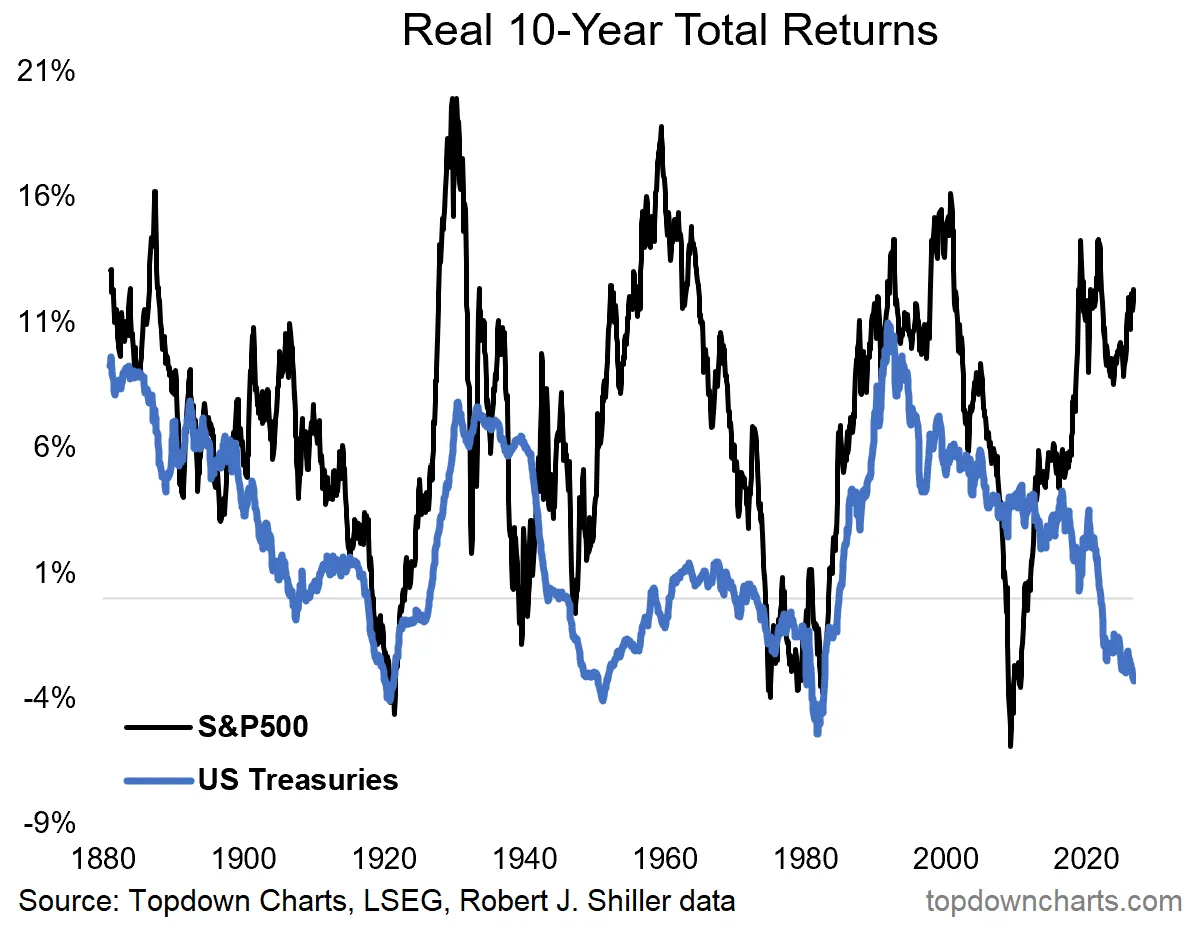
Over the past 10 years, the S&P 500‘s inflation-adjusted total return has averaged about 12% annually, compared with roughly negative 3% for U.S. Treasuries. That produces a 15-percentage-point annual advantage for stocks.
Topdown Charts notes that the rolling 10-year annualized total-return spread between stocks and bonds recently exceeded 15 percentage points. The calculation includes dividends from stocks and interest from bonds, making it a more useful comparison than simply looking at price changes.
The historical comparison is even more striking. The average long-term advantage for stocks over Treasuries since the 1880s has been around 5 percentage points. The current spread is therefore roughly three times that historical norm.
Excluding the late 1950s, Topdown Charts says the current gap represents the largest stock-market outperformance over Treasuries in U.S. financial-market history.
Inflation Has Been Bonds’ Biggest Problem
The culprit is not difficult to identify. Treasuries suffered through a brutal period as inflation and interest rates rose. Higher yields push existing bond prices lower, while inflation erodes the purchasing power of fixed interest payments. The result has been a decade of negative real returns for Treasuries — roughly -3% annually, according to the analysis.
Stocks faced the same inflationary environment but had an important advantage: Companies can raise prices, grow revenue, expand profits, and return more cash to shareholders over time.
That doesn’t make equities risk-free. The S&P 500 can fall 20%, 30%, or more during a bear market. But investors who own productive businesses have a claim on growing earnings, whereas a Treasury ultimately promises a fixed stream of payments. That distinction matters when inflation refuses to cooperate.
The Catch For Stock Investors
Here’s where things get interesting. The chart isn’t simply a flashing green light for stocks. Topdown Charts points out that stocks and bonds appear to move through long-term cycles, and today’s extraordinary stock outperformance could eventually reverse.
In fact, Topdown Charts says stocks currently look expensive relative to bonds, while acknowledging that macroeconomic conditions, policy, and market trends still favor equities for now.
Investors shouldn’t buy stocks because they assume another 15-percentage-point annual advantage is coming. That would be extrapolating an extraordinary decade into the future. Instead, the chart reinforces a more durable investing principle: productive assets have historically rewarded investors willing to tolerate volatility and hold them for the long haul.
Key Takeaway
In short, the 15-percentage-point stock-versus-bond gap is both a bullish signal and a warning.
Stocks have dominated because corporate earnings and dividends have compounded while inflation devastated real bond returns. That advantage could narrow if economic growth weakens, inflation falls, or interest rates decline sharply.
Granted, bonds now offer more attractive yields than they did several years ago. But for investors with a long time horizon, the data still make a compelling case for keeping stocks at the center of a diversified portfolio.
Ultimately, investors don’t need to predict the next market cycle. They need assets capable of growing faster than inflation. Over the past decade, stocks have done exactly that — and by a margin rarely seen before.
Contact [email protected] for any questions or corrections.
After two decades of patrolling the dark corners of suburbia as a police officer, Rich Duprey hung up his badge and gun to begin writing full time about stocks and investing. For the past 20 years, he’s been cruising the markets looking for companies to lock up as long-term holdings in a portfolio while writing extensively on the broad sectors of consumer goods, technology, and industrials. Because his experience isn’t from the typical financial analyst track, Rich is able to break down complex topics into understandable and useful action points for the average investor. His writings have appeared on The Motley Fool, InvestorPlace, Yahoo! Finance, Money Morning, and, of course, 24/7 Wall St. He has been featured in both U.S. and international publications, including MarketWatch, Financial Times, Forbes, Fast Company, and USA Today.