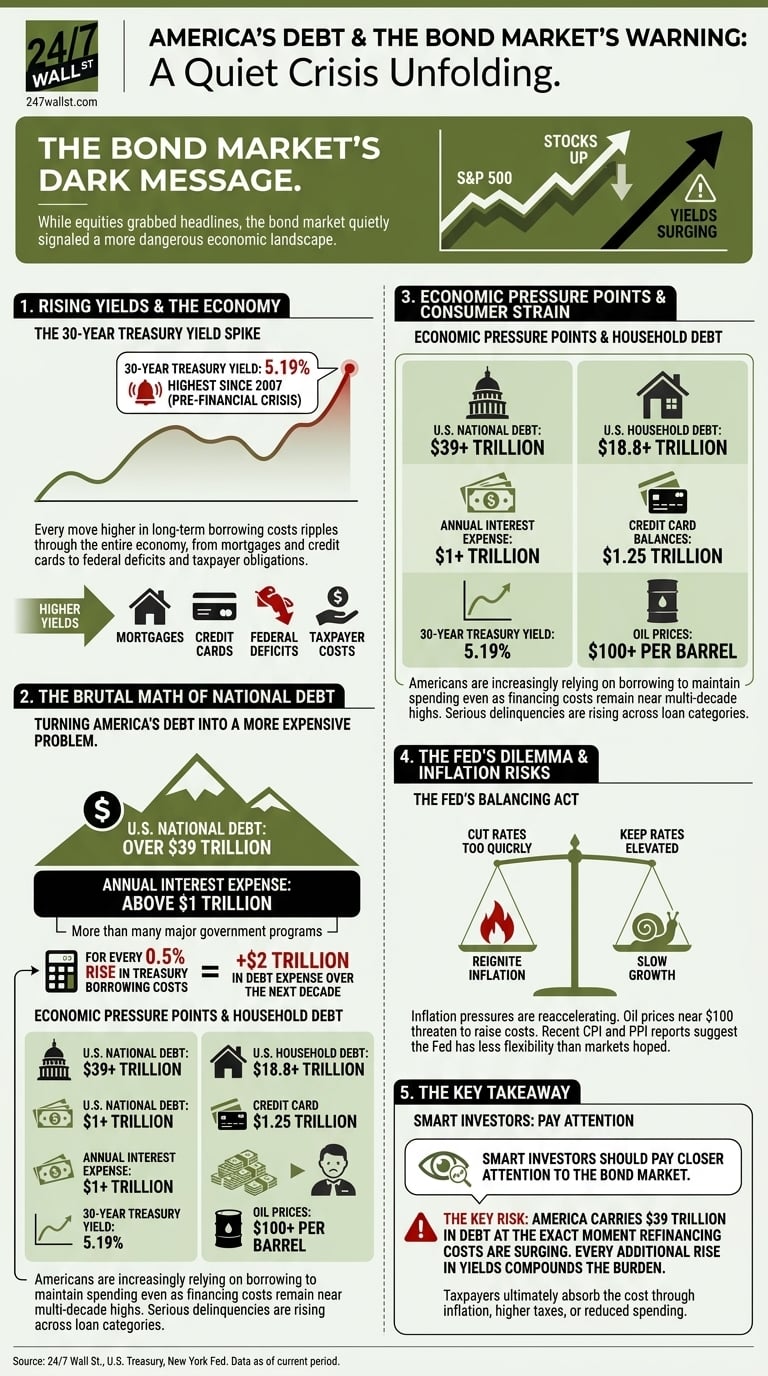
For most of the past two years, investors have focused on the stock market’s resilience. The S&P 500 kept climbing, artificial intelligence spending exploded, and traders repeatedly bet the Federal Reserve would ride to the rescue with lower interest rates. But while equities grabbed the headlines, the bond market quietly started delivering a much darker message.
Now that message is getting harder to ignore.
The 30-year Treasury yield recently climbed to 5.19%, according to U.S. Treasury market data — the highest level since 2007, just before the financial crisis reshaped global markets. Why does that matter? Because every move higher in long-term borrowing costs ripples through the entire economy, from mortgages and credit cards to federal deficits and taxpayer obligations. Contrastingly, shorter-duration Treasury auctions highlight a stark structural shift, with 20-year bonds climbing to 5.122% while ultra-short T-bills present a more resilient baseline around 3.6% to 3.7%.
Rising Yields Are Turning America’s Debt Into a More Expensive Problem
For every half-percentage-point rise in Treasury borrowing costs, the federal government adds roughly $2 trillion in debt expense over the next decade relative to prior budget projections. That’s not theoretical. It’s the direct consequence of refinancing a mountain of existing debt at higher rates.
According to U.S. Treasury data, total national debt now hits $39.0 trillion, compounding at an average of $7.39 billion per day. Annual interest expense alone has already climbed above $1 trillion, consuming roughly 14% of total federal outlays. That means Washington is now spending more on interest payments than on many major government programs, driven by a marketable debt cost that has ticked up steadily year-over-year to 3.373%.
Granted, the U.S. has carried large debt loads before. The difference today is the speed at which borrowing costs are rising while deficits remain elevated.
Consider the backdrop:
| Economic Pressure Point | Current Figure | Structural Vector |
| U.S. National Debt | $39.0 Trillion | Compounding at an average of $7.39 billion per day. |
| Avg. Interest Rate on Debt | 3.373% | Marketable debt cost is up from 3.354% year-over-year. |
| Annual Interest Expense | Above $1 Trillion | Consuming roughly 14% of total federal outlays. |
| Producer Price Index (PPI) | +6.0% YoY | Driven by a 1.4% single-month reacceleration in wholesale costs. |
| Consumer Credit Strain | $18.19 Trillion | Deepening K-shaped strain; rising subprime originations. |
| Energy Input (Brent Crude) | ~$106 / barrel | Supply deficits keeping pressure active through Q2 2026. |
Essentially, the federal government is borrowing heavily into a rising-rate environment. That combination rarely ends cheaply.
Consumers Are Feeling the Same Pressure
The government isn’t the only borrower under strain. According to New York Fed household credit data, total U.S. consumer credit strain has intensified. Rather than a uniform impact, the data reveals an increasingly pronounced K-shaped consumer credit landscape; while prime borrowers hold stable, subprime credit card originations have surged by double digits, forcing banks into higher write-off rates to preserve asset quality.
In short, Americans are increasingly relying on borrowing to maintain spending even as financing costs remain near multi-decade highs.
That creates a dangerous setup for the broader economy because higher Treasury yields don’t stay confined to Washington. Mortgage rates, auto loans, business lending, and credit cards all move higher alongside government borrowing costs.
Surprisingly, many investors expected 2026 to bring aggressive Fed rate cuts. Instead, inflation pressures are starting to reaccelerate sharply.
Brent crude oil prices averaging $106 per barrel due to global inventory drawdowns threaten to raise transportation, manufacturing, and consumer costs again. Recent inflation metrics underscore this friction, with the final demand Producer Price Index jumping 1.4% in a single month to register a 6.0% annualized gain, fueled by a 15.6% spike in gasoline and a 22.7% annual rise across wholesale energy components. These metrics suggest that the Federal Reserve may have less flexibility than markets hoped.
That said, the Fed now faces a difficult balancing act. Cutting rates too quickly could reignite inflation. Keeping rates elevated risks slowing growth while debt costs continue compounding.
The Bond Market Is Warning Investors About Instability Ahead
Bond investors tend to focus less on headlines and more on arithmetic. Right now, the arithmetic is becoming uncomfortable.
The combination of 5.19% long-term Treasury yields, rising inflation pressures, $106 oil, massive federal deficits, and fading hopes for Fed rate cuts creates an environment that looks increasingly unstable. In short, the bond market is signaling concern that America’s debt growth is outpacing its ability to finance it cheaply.
That doesn’t guarantee a crisis tomorrow. The U.S. dollar remains the world’s reserve currency, and Treasury markets are still the deepest in the world. But when all is said and done, taxpayers ultimately absorb the cost of higher borrowing — either through inflation, higher taxes, reduced spending flexibility, or all three.
The Investor Playbook: Navigating the Bond Drag
When long-term yields sustain levels above 5%, the gravity pulling on traditional asset models changes. Investors looking to insulate portfolios against this drag frequently pivot to shorter-duration fixed-income options like floating-rate notes or ultra-short T-bills to capture yield while avoiding the capital risk of long-term paper. Additionally, capital tends to rotate toward mega-cap equities with high free cash flow and fortress balance sheets that operate as net creditors rather than rolling over expensive debt, alongside targeted commodity exposure to hedge against upstream producer cost surges.
Key Takeaway
Smart investors should pay closer attention to the bond market than they have over the past year. Stocks can ignore rising debt costs for a while. Bond markets usually don’t.
The key risk isn’t simply that rates are high. It’s that America now carries $39 trillion in debt at the exact moment refinancing costs are surging. Every additional rise in yields compounds the burden.
For taxpayers, that half-point move higher in rates translating into $2 trillion in added debt expense isn’t just a market statistic. It’s a warning about how expensive America’s borrowing habit is becoming.
Editor’s Note: This article has been updated to incorporate recent macroeconomic metrics, including updated federal debt accumulation figures, current short- and long-term Treasury auction yields, specific monthly and annualized Producer Price Index growth rates, specific Brent crude energy prices, and targeted consumer credit trends detailing a split between prime and subprime borrowers, alongside a new strategic analysis regarding asset allocation adjustments for retail investors.
Contact [email protected] for any questions or corrections.