Trump First President To See National Debt Hit 100% Of GDP Since Harry Truman
For the first time in generations, a milestone in the federal debt-to-GDP ratio has arrived that most economists hoped never to see again, and the forces that drove it there make it nearly impossible to reverse.


Debt held by the public hit 100% of gross domestic product for the fiscal year that ended Sept. 30. The Wall Street Journal reported Thursday that this is the first time the ratio has reached triple digits since 1946. Harry Truman was president in 1946, so President Trump is the first president since Truman to see the fiscal-year ratio this high. That comparison marks the date and places no blame. The Journal links the debt to decades of tax cuts, emergency spending and an aging population under both parties.
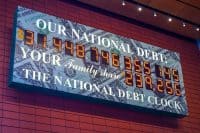
The Journal said the government reported $32.2 trillion in publicly held debt as of Sept. 30. Measured against GDP for the fiscal year, using the third-quarter figures released Thursday, that came to 100.03%, just over the line. The Journal reported that the ratio was 99.4% at the end of fiscal 2025 and that the result came in below the Congressional Budget Office’s February forecast of 100.6%. The record is 106%, set in 1946 after the borrowing that paid for World War II.
Which Debt Number Actually Matters
Most headlines cite gross federal debt, which recently passed $40 trillion. Economists prefer debt held by the public because it better measures the burden of borrowing, the Journal reported. The gross figure includes money one part of the government owes another, such as Treasury securities held in the Social Security trust fund. Debt held by the public is the money owed to outside lenders, and they set the price of borrowing.
Two Decades of Borrowing Under Both Parties
In 2000, the Journal reported, the ratio was 33.7% and falling. The government was running surpluses, helped by a strong economy, spending restraint and capital-gains taxes from the dot-com boom. Congress then passed multiple tax cuts and raised spending in response to the Sept. 11 attacks, the 2008 to 2009 financial crisis and the Covid-19 pandemic. Meanwhile, an aging population pushed up Social Security and Medicare costs. No single president or party produced this number.
Why 100% Is a Shaky Milestone
The fiscal-year figure is the official milestone, but the country had already passed the line once. The Journal reported that the U.S. hit 100% in an intrayear calculation earlier this year. The Committee for a Responsible Federal Budget, as cited by Fortune, put the trailing ratio at 100.2% at the end of March. The Journal noted that revisions to third-quarter GDP or changes in how the Treasury issues debt could still change the final ratio. With the figure this close to 100%, a small revision could move it to either side of the line.
Interest Costs Are the Pressure Point
The Journal put the fiscal 2026 deficit at nearly $2 trillion, or 6.2% of GDP. Deficits that large are unusual outside of wars, recessions and emergencies. The Social Security Trustees project that the retirement trust fund will run out in 2032. After that, only 78% of scheduled benefits could be paid unless Congress acts.
The CBO projects rising net interest costs. They will rise by more than 1% of GDP over the next decade, and that forecast assumed interest rates well below today’s. On Oct. 28 the 10-year Treasury yield was at 5.05% and the 30-year at 5.37%. By the Journal’s math, rates running just 0.1 percentage point above CBO’s forecasts would add $379 billion in interest over a decade. Those same yields also set the rates families pay on mortgages and other long-term loans.
CBO Director Phillip Swagel spoke at an event this month. As reported by the Journal, he said: “I think there is understanding about the challenging fiscal trajectory. Of course, the difficulty is that the U.S. is a divided country and a divided society and we’re divided politically.”
What Moves the Ratio Next
Three things will decide where the ratio goes. The first is GDP revisions, since a change to third-quarter output could move the figure back below 100%, and the second is interest rates, because if long-term Treasury yields stay near 5%, interest costs will keep running above what CBO assumed. The third is Congress, which has to deal with the Social Security shortfall before 2032 or accept automatic benefit cuts.
Contact [email protected] for any questions or corrections.
AJ spent 10 years writing about financial markets at The Motley Fool. His coverage centers on technology stocks and the broader macroeconomic trends, from interest rates to geopolitics, that shape where markets are headed next. AJ is drawn to the stories where big-picture economics and individual companies collide.