Meet Wall Street’s Reliable High-Yield Dividend Stocks: 5 Companies That Pass the Yield Trap Test

This post may contain links from our sponsors and affiliates, and Flywheel Publishing may receive compensation for actions taken through them.
A fat yield can be a warning label. Yield traps tend to look the same: a payout inflated by a sliding share price, thin coverage, climbing debt or shrinking cash flow (we listed the seven warning signs that a big yield is about to be cut in a free report here: Dividend Traps). With the 10-year Treasury yielding 5.12%[1], income investors have little reason to accept any of those flaws. This edition of the Powerhouses series combines pipelines and equity REITs and runs each one through the trap test using the right coverage metric for the business: distributable cash flow (DCF) for midstream, and adjusted funds from operations (AFFO) for REITs. Five names pass.
VICI Properties: Ultra-High-Yield Rent From Las Vegas Landmarks
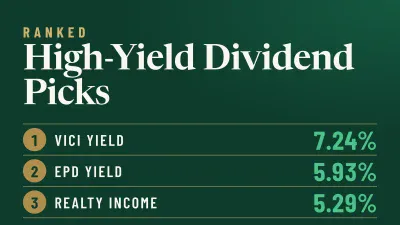
VICI Properties (NYSE: VICI) yields 7.24%. That makes it the only ultra-high-yield name in this group. It owns 103 experiential assets, including Caesars Palace Las Vegas, MGM Grand and the Venetian Resort. All of them sit under long triple-net leases, which means tenants pay the taxes, insurance and maintenance.
Trap test: Shares are down 13.11% over the past year, so part of that yield does come from price. Cash flow moved the other way. Third-quarter AFFO rose 7.5%[2] year over year to $685.2 million, and management raised full-year AFFO guidance to $2.47 to $2.48 per diluted share. That sits well above the $1.84 annualized dividend. GAAP EPS dropped to $0.31[2] because of a $458 million non-cash CECL charge. The reserve is purely accounting, set against the loan book, and does not reduce the rent tenants pay.
Balance sheet and track record: Occupancy is 100%, the weighted average lease term is 39.4 years, and VICI carries investment-grade ratings from Moody’s, S&P and Fitch. The quarterly dividend rose to $0.46 from $0.45, which was its 9th consecutive annual increase[2] since the 2017 IPO.
Bull case: The stock trades at 0.949 times book value and 8 times forward earnings. The board also authorized a $2.0 billion[2] buyback. Rent increases are written into the leases, so the payout has built-in growth.
Risk: Caesars accounts for 38% of rent and MGM for 32%, so trouble at either tenant would hit income directly.
Enterprise Products Partners: High-Yield Pipeline Income With Cash to Spare
Enterprise Products Partners (NYSE: EPD | EPD Price Prediction) yields 5.93%, the highest yield among the three midstream picks. Units are up 23.41% over the past year, so the yield has held up while the price climbed. It’s the opposite of a trap.
Coverage: Third-quarter operational DCF of about $2.3 billion[3] covered the distribution 1.9x. The partnership kept $1.1 billion[3] of DCF to fund reinvestment, buybacks and debt reduction. It bought back $112 million of units in the quarter under a $5.0 billion program that is 36% used.
Track record: The quarterly distribution is $0.56, or $2.24 annualized, up 2.8%[3] year over year. It has risen in steps from $0.515 in early 2024, and the payment record goes back to 1999.
Bull case: Enterprise has $6.3 billion[3] of growth projects under construction through 2028, and Permian processing inlet volumes hit a record 4.6 Bcf/d. The units trade at 12 times trailing earnings with a beta of 0.459, so you get a cheap multiple and low volatility in one holding.
Caveat: Enterprise is a master limited partnership. It sends investors a K-1 tax form instead of a 1099, which makes tax filing more complicated and can create issues when the units are held in an IRA or other retirement account.
Realty Income: High-Yield Monthly Checks With Decades of Raises
Realty Income (NYSE: O) yields 5.29% and pays every month. Shares are up 7.01% over the past year, so a falling price is not what is raising the yield.
Coverage: Third-quarter AFFO came in at $1.12 per share, up 3.7%. Management raised full-year AFFO guidance to $4.45 to $4.46 per share, against a forward annualized dividend of $3.288. Occupancy is 98.8%, and re-leased properties are bringing in 103.5% of their prior rent.
Track record: The company recently announced its 676th consecutive monthly dividend[4] and then declared its 137th monthly dividend increase. That raised the monthly payment to $0.274 from $0.2715. Fitch rates the company ‘A’[5], and 34.3% of annualized base rent comes from investment-grade tenants.
Bull case: Realty Income committed $2.6 billion last quarter at a 6.8% initial cash yield, and it confirmed $10.0 billion of investment volume for the year. Its free cash flow yield of 7.00% gives the monthly check a solid cushion.
Risk: Interest coverage is only 1.42x and net debt is 7.81x EBITDA. With long-term rates raised, refinancing will cost more and could slow dividend growth.
Kinder Morgan: Natural Gas Dividend Growth With an Upgraded Balance Sheet
Kinder Morgan (NYSE: KMI) yields 3.71%. That is less current income than the names above, but the payout rests on one of the strongest balance sheets in midstream. Shares are up 18.66% over the past year.
Coverage: In its second-quarter report, Kinder Morgan generated $978 million[6] of free cash flow on $2.0 billion of operating cash flow. Over the trailing twelve months it earned $1.62 per share against $1.185 in dividends paid.
Balance sheet and track record: Net debt stands at 3.6x[6] adjusted EBITDA, the low end of the company’s target range, and Moody’s upgraded Kinder Morgan to Baa1[7]. The quarterly dividend has gone up every year in the record, from $0.2625 in 2020 to $0.2975 today.
Bull case: As of its second-quarter report, Kinder Morgan had a project backlog of $9.6 billion. That backlog is 92% natural gas, and more than 60% of it is tied to power generation and local utility demand.
Risk: The yield is below the 10-year Treasury, and the latest raise was only 2%[6]. Income investors will need years of steady increases to come out ahead of bonds.
Williams Companies: Fastest-Rising Payout Behind America’s Gas Highway
Williams Companies (NYSE: WMB) yields 3.07%. Its pipelines carry about one third of U.S. natural gas, and most of its revenue comes from fees. Shares are up 15.23% over the past year.
Coverage: Williams guides to 2.47x[8] dividend coverage on available funds from operations of $5.15 per share, against an annualized dividend of $2.10. The widest coverage margin in this group. Third-quarter adjusted EBITDA rose 6%[8] to $2.04 billion.
Balance sheet and track record: Leverage is expected to land around 3.75x[8]. The quarterly dividend has been raised every year in the data, from $0.41 in 2021 to $0.525 this year.
Bull case: Williams closed the $2.816 billion Momentum Midstream acquisition, which strengthens its position in the Haynesville. Management is also aiming 11% plus annual adjusted EBITDA growth through 2030, driven by LNG exports and power demand.
Risk: You pay up for that growth. Williams trades at 27 times trailing earnings and plans $7.3 billion to $7.9 billion of growth capex this year.
Five Payouts That Pass the Yield Trap Test
Each of these five pays from cash flow that tops the dividend, measured with the metric that fits its business. Each also has a balance sheet that is stable or getting stronger. VICI and Enterprise Products deliver the most current income, and Realty Income pays monthly with the longest record of increases. Kinder Morgan and Williams yield less today but have their payouts tied to rising natural gas demand.
Contact [email protected] for any questions or corrections.
Lee Jackson has covered Wall Street analysts' equity and debt research and equity strategy daily for 24/7 Wall St. since 2012. His broad, diverse career, including a stint as creative services director at an NBC affiliate in Austin, Texas, gives him unique insight into the financial industry.
Lee Jackson's journey in the financial industry spans more than 30 years, including nearly two decades as an institutional equity salesperson at Bear Stearns, Lehman Brothers, and Morgan Stanley. His career spanned pivotal sell-side Wall Street events, from the dot-com rise and bubble to the Long-Term Capital Management debacle, 9/11, and the Great Recession of 2008. This reflects his resilience and adaptability amid market volatility.
Lee Jackson’s practical financial industry experience, gained through a career at some of the biggest banks and brokerage firms, is complemented by a lifetime of writing across various platforms. This unique combination allows him to shed light on the intricacies of Wall Street in a way only someone with deep insider experience and knowledge can. Moreover, his extensive network across Wall Street continues to provide direct access for him and 24/7 Wall St., a privilege few firms enjoy.
Since 2012, Jackson’s work for 24/7 Wall St. has been featured in Barron’s, Yahoo Finance, MarketWatch, Business Insider, TradingView, Real Money, The Street, Seeking Alpha, Benzinga, and other media outlets. He attended the prestigious Cranbrook Schools in Bloomfield Hills, Michigan, and has a degree in broadcasting from the Specs Howard School of Media Arts.