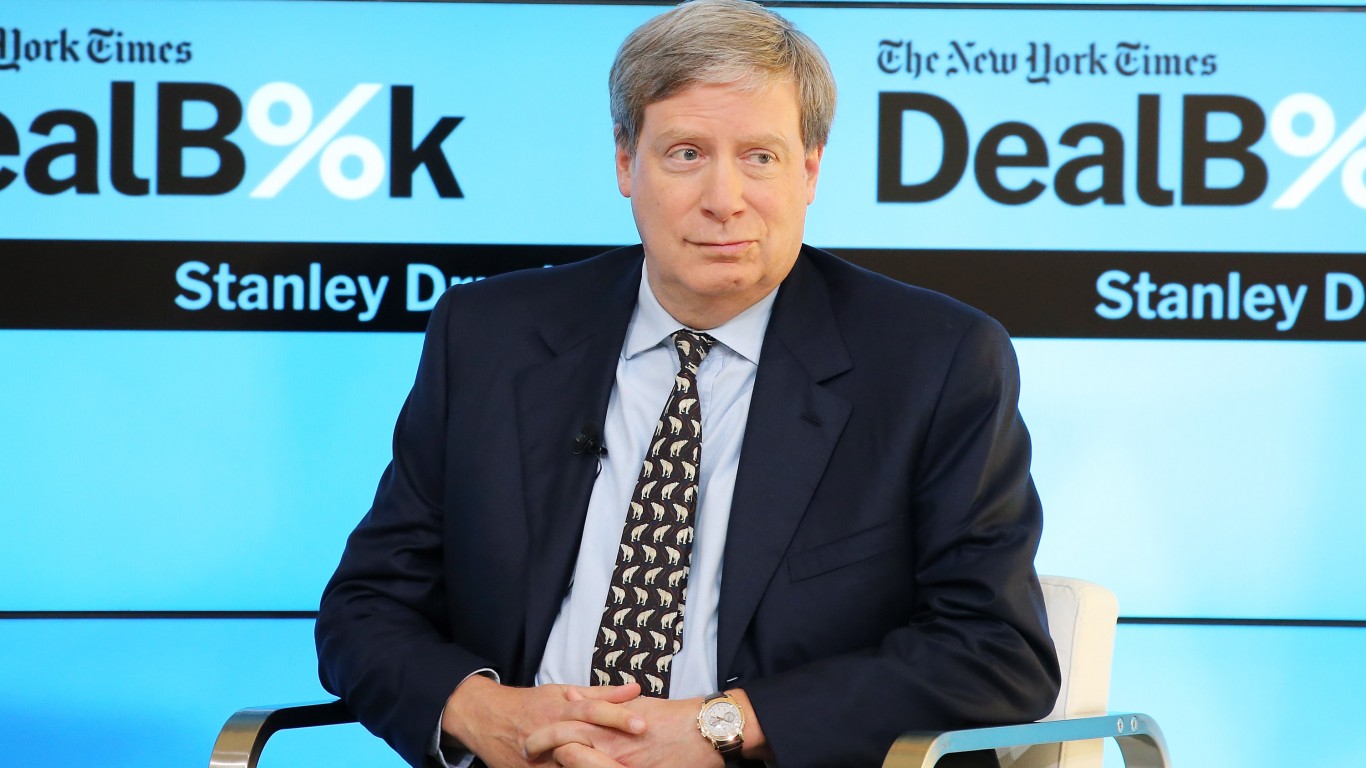
Druckenmiller Bought 3 Gold Miners. History Shows How These Moves Usually Play Out.

This post may contain links from our sponsors and affiliates, and Flywheel Publishing may receive compensation for actions taken through them.

Although gold miners spent much of 2026 doling out record cash flows, investors have started selling the group this fall. During the year, the three biggest producers reported realized gold prices ranging from $4,234 an ounce[1] at Barrick Mining (NYSE:B) to $4,900 an ounce[2] at Newmont (NYSE:NEM | NEM Price Prediction). Billionaire Stanley Druckenmiller’s Duquesne Family Office opened positions in all three during the quarter ended Sept. 30, 2026[3]. But history shows that buying gold miners after a surge lasting several quarters can pay off or backfire, and the weeks since then have favored the bears.
A 13F is the quarterly report large money managers file with the SEC, listing their U.S. stock holdings as of the last day of the quarter. Duquesne’s 13F, filed Nov. 16, 2026[3], shows new positions of 380,400[3] shares of Newmont, 1,054,600 shares of Barrick, and 231,050 shares of Agnico Eagle Mines (NYSE:AEM). The filing gives no reasons for the purchases. It also reflects holdings only as of Sept. 30, so it cannot confirm what Duquesne owns today. The same report showed Druckenmiller reshuffling his data storage holdings as well.
However, all three stocks have fallen since the filing’s as-of date. From Sept. 30 through Nov. 18, the SPDR Gold Shares (NYSEARCA:GLD) fell 10.4%. Over the same stretch, Newmont slipped 9.4%, Agnico Eagle dropped 11.7%, and Barrick tumbled 15.3%. The past week hit the miners harder. GLD lost 4.6%, while Newmont fell 7.7%, Barrick dropped 8.8%, and Agnico Eagle slid 9.9%.
Why Miners Swing Harder Than Bullion
Most of a miner’s costs are fixed. Crews, fuel, equipment, and processing cost about the same whether gold rises or falls, so a change in the gold price affects profits much more than revenue. Newmont’s third-quarter report guided 2026 all-in sustaining costs (AISC, the industry’s measure of what it costs to keep mines running) to $1,900 an ounce[4], against a realized price of $4,317. Barrick posted third-quarter AISC of $1,911 an ounce while its EBITDA margin (earnings before interest, taxes, depreciation, and amortization as a share of revenue) remained 60%. With costs fixed, a given percentage move in gold produces a larger percentage move in margins, whether gold is rising or falling.
What 2011 and 2020 Taught Gold Investors
The last major gold peak shows this leverage working against shareholders. From the end of December 2008 to the end of August 2011, GLD rose 105.4%, while Newmont returned a smaller 57.6% on a dividend-adjusted basis. After gold peaked, Newmont fell much harder. From August 2011 through the end of 2013, GLD declined 34.7% and Newmont lost 60.3%. By the end of 2015, those losses had grown to 42.9% for GLD and 68.6% for Newmont.
The 2020 rally showed the upside. From March 16 to Aug. 7, 2020, GLD rose 34.7%. Newmont returned 70.0% and Agnico Eagle 113.5% over the same window. Across both cycles, miners magnified gold’s moves, and the worst damage came after gold’s long rise ended.
Valuation Gut Check
Despite the selloff, the three miners trade at modest earnings multiples. Newmont trades at 12 times trailing earnings and 11 times forward estimates. Barrick trades at 9 times on both measures, while Agnico Eagle trades at 14 times trailing and 15 times forward. Those earnings were set when gold sold at record prices, and Newmont’s midyear and Q3 guidance assumed $4,500 an ounce[4]. Cash returns could help limit losses. Newmont generated record first-quarter free cash flow of $3.1 billion and $7.3 billion through the first nine months of the year. It has also authorized an additional $6.0 billion[2] buyback, while Barrick approved a new $3.0 billion[5] repurchase program.
Mine-Level Problems Add to the Risk
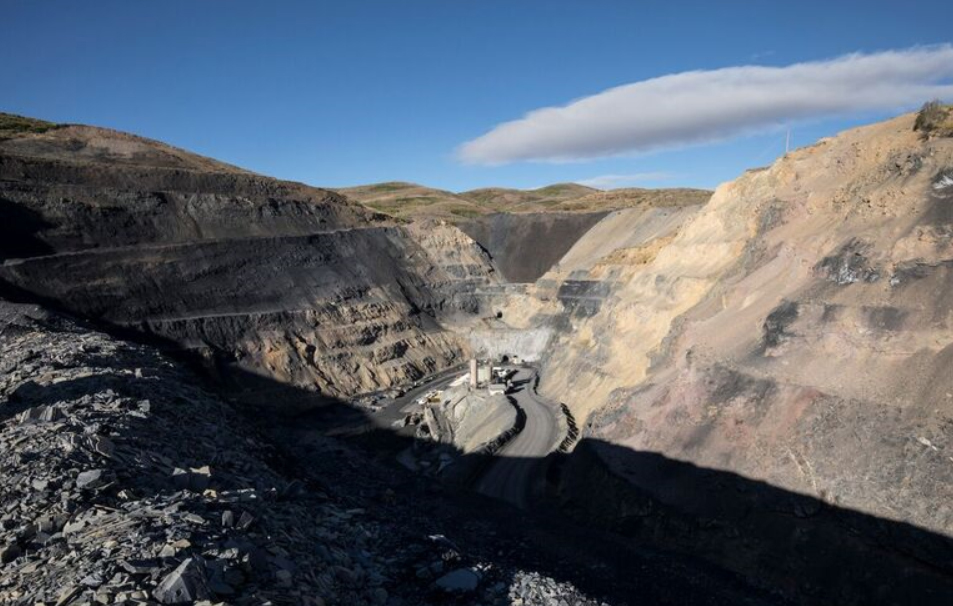
Each miner also faces its own problems. Agnico Eagle’s third-quarter report reiterated that it expects a July 1[6] rock mass movement at its Barnat pit to cut Canadian Malartic output by 60,000 to 80,000 ounces in the second half of 2026 and up to 150,000 ounces in each of 2027 and 2028. A seismic event at Newmont’s Cadia mine cut total copper production 43%[4] from the prior quarter. Barrick’s third-quarter report affirmed its plan to hold an IPO of its North American gold assets by year-end 2026[5].
GLD Levels That Could Decide the Trade
History suggests these three positions depend mainly on gold’s next move. If gold rises, the 2020 pattern suggests the miners should outrun it. If gold keeps sliding, the 2011 to 2015 record suggests they will fall harder. GLD closed Sept. 30 at $380.84 and has traded as low as $340.76 in November. A sustained move back above the Sept. 30 close would point toward a repeat of 2020. A break below the November low would point toward a repeat of 2011.
Over longer periods, Wall Street has rewarded patient holders of gold miners. Over the past ten years, Newmont returned 306.9% and Agnico Eagle 364.6%, compared with 196.7% for GLD. Barrick’s 172.4% gain trailed the metal. Over the next few months, however, history suggests gold’s direction will decide whether these three miners recover or keep falling.


Contact [email protected] for any questions or corrections.
Trey has been an editor and author at 24/7 Wall St. for more than a decade, where he has published thousands of articles analyzing corporate earnings, dividend stocks, short interest, insider buying, private equity, and market trends. His comprehensive coverage spans the full spectrum of financial markets, from blue-chip stalwarts to emerging growth companies.
Beyond 24/7 Wall St., Trey has created and edited financial content for Benzinga and AOL's BloggingStocks, contributing additional hundreds of articles to the investment community.
Trey's editorial expertise extends across multiple publishing environments. He served as production editor at Dearborn Financial Publishing and development editor at Kaplan, where he helped shape financial education materials. Earlier in his career, he worked as a writer-producer at SVE. His freelance editing portfolio includes work for prestigious clients such as Sage Publications, Rand McNally, the Institute for Supply Management, the American Library Association, Eggplant Literary Productions, and Spiegel.
Outside of financial journalism, Trey writes fiction and has been an active member of the writing community for years, moderating workshop sessions at regional conventions.