The Dow Jones Did Something It Hasn’t Done Since October 2008

This post may contain links from our sponsors and affiliates, and Flywheel Publishing may receive compensation for actions taken through them.
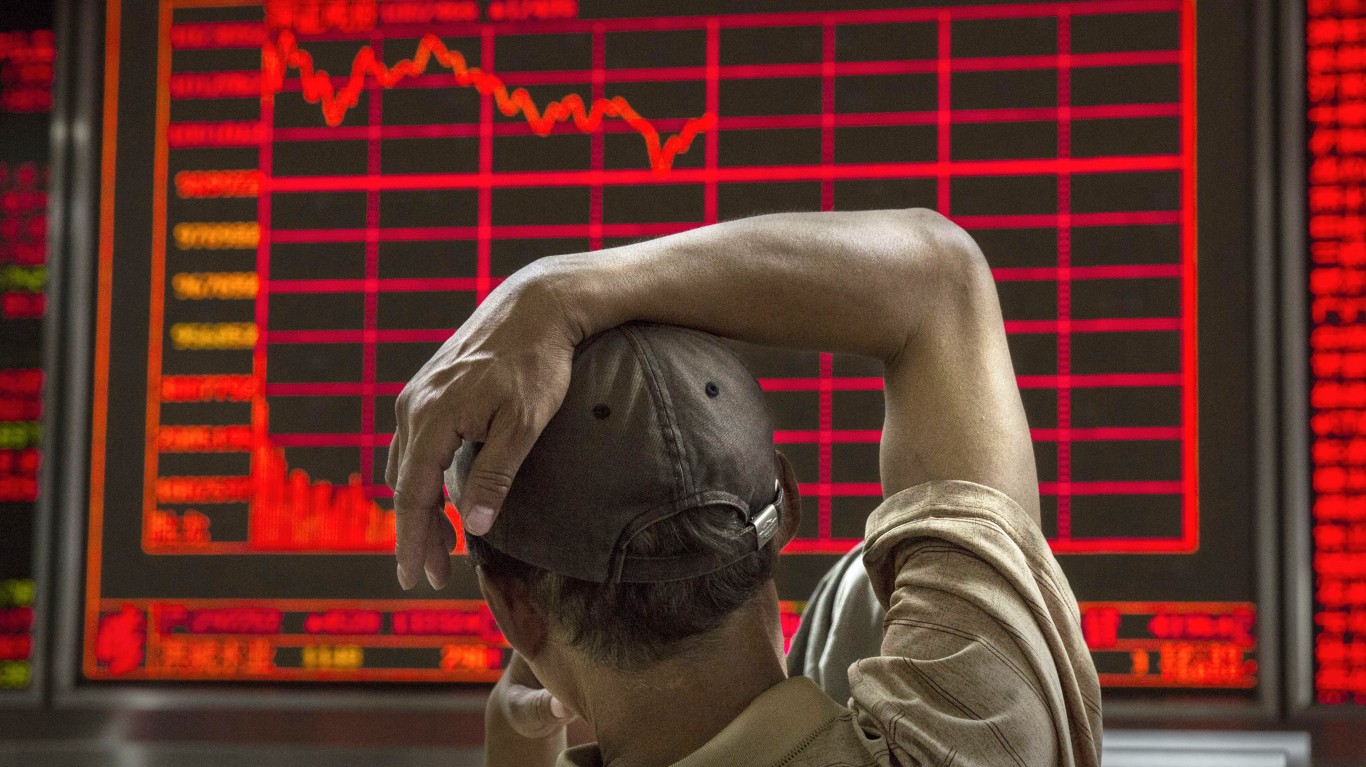
The Dow Jones Industrial Average fell at least 1% on all five trading days of the week ended November 20, 2026. The last run of five or more straight declines of that size ended Friday, October 10, 2008, based on daily Dow data dating back to 1992.
The selling accelerated late in the week: after losses of 1.41% on Monday, November 16, 1.64% on Tuesday and 1.11% on Wednesday, the index posted its steepest drops of 2.19% on Thursday and 1.93% on Friday. It closed Friday at 48,147.33, down 949.73 points, after hitting an intraday low of 47,998.86, just under 48,000.
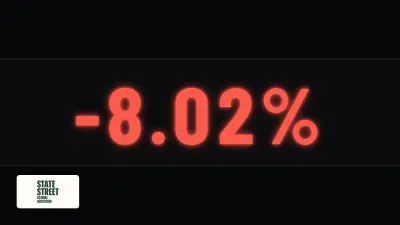
Measured from the November 13 close of 52,347.55, the Dow lost 4,200.22 points, or 8.02%. It was the worst week since the week ended March 20, 2020, although only slightly worse than the 7.86% drop in the week ended April 4, 2025.
If you own the State Street SPDR Dow Jones Industrial Average ETF Trust (NYSEARCA:DIA), the fall hit your holdings directly, because the fund tracks the same price-weighted index.
Correction Territory With 2026 Gains Nearly Gone
The Dow now sits 11.4% below its August 5, 2026 record close of 54,349.12. A correction is a drop of 10% or more from a peak, and a bear market begins at 20%.
Friday’s close was the lowest since April 10, 2026. The index is up just 0.17% from its December 31, 2025 close of 48,063.29.
The VIX, which uses options prices to measure expected volatility, closed at 28.44[1] on November 19, up 52.1% in a week. That is just below the level of 30 that usually signals high fear.
Why Goldman Sachs and Caterpillar Outweighed NVIDIA
The selling came from fading confidence in the AI trade. Investors worried that AI stock prices and spending had rose too high, and midterm wins by candidates who support slowing data center construction added to the pressure. Riding a mania is one thing; planning the exit is the harder half, which is the whole subject of our free bubble survivor’s handbook.
The Dow is price-weighted, which means each member’s pull on the index comes from its share price alone. A high-priced stock moves the index more than a larger company with a lower share price. Goldman Sachs (NYSE:GS | GS Price Prediction) is the largest weight at 9.75%, and it fell 6.71% to $790.69. Caterpillar (NYSE:CAT) is second at 6.29%, and it fell 5.01% to $510.45.
NVIDIA (NASDAQ:NVDA) dropped 14.01%, but at $125.53 a share, it moved the index far less. Cisco fell 4.29%, and Amazon fell 4.10%.
Defensive stocks rose. UnitedHealth gained 2.84%, Walmart 1.52%, and Johnson & Johnson 1.25%, and Procter & Gamble also finished higher. The S&P 500 broke the streak because it fell only 0.23% on Wednesday.
What October 2008 Can and Cannot Tell You
The 2008 streak lasted seven sessions and took the Dow from 10,831.07 to 8,451.19, a loss of about 22%. That included a 7.33% drop on October 9.
In the very next session, on October 13, 2008, the Dow jumped 11.08%. That rally did not mark the bottom, because the credit crisis was still spreading and the index went on to make lower lows.
The cause is different this time: AI expectations are being repriced, whereas in 2008 banks were failing. The 2008 lesson still applies: a sharp bounce after a streak like this tells you little about where the selling ends.
What This Week Means for DIA Holders
DIA closed Friday at $481.08. Its daily losses of 1.43%, 1.62%, 1.10%, 2.18% and 1.98% closely tracked the index, showing how directly the slide reached holders. The fund holds the same price-weighted blue chips as the index, so most of your exposure sits in the high-priced financial and industrial stocks that are leading the fall.
DIA’s structure places a large share of holders’ money in Goldman and Caterpillar just as AI-linked cyclicals are being sold off, which makes the fund more exposed to this fall than its blue-chip label suggests.
For comparison, consider the structure of the Invesco S&P 500 Equal Weight ETF (NYSEARCA:RSP), which gives every member the same weight and charges a 0.2% expense ratio. It fell 6.2% for the week and is up 9.58% for 2026.
Markets reopen Monday, November 23. They close for Thanksgiving on November 26 and close early on November 27, and the Fed meets in December with its target rate capped at 4.00%[2]. A close back above 52,347.55 would erase the week’s losses, while a close below 47,998.86 would likely signal that the selling has further to run.
Contact [email protected] for any questions or corrections.
Omor Ibne Ehsan is a writer at 24/7 Wall St. He is a self-taught investor with a focus on growth, cyclical, and dividend equities that have strong fundamentals, value, and long-term potential. He also has an interest in high-risk, high-reward investments such as penny stocks.